Figure 3.

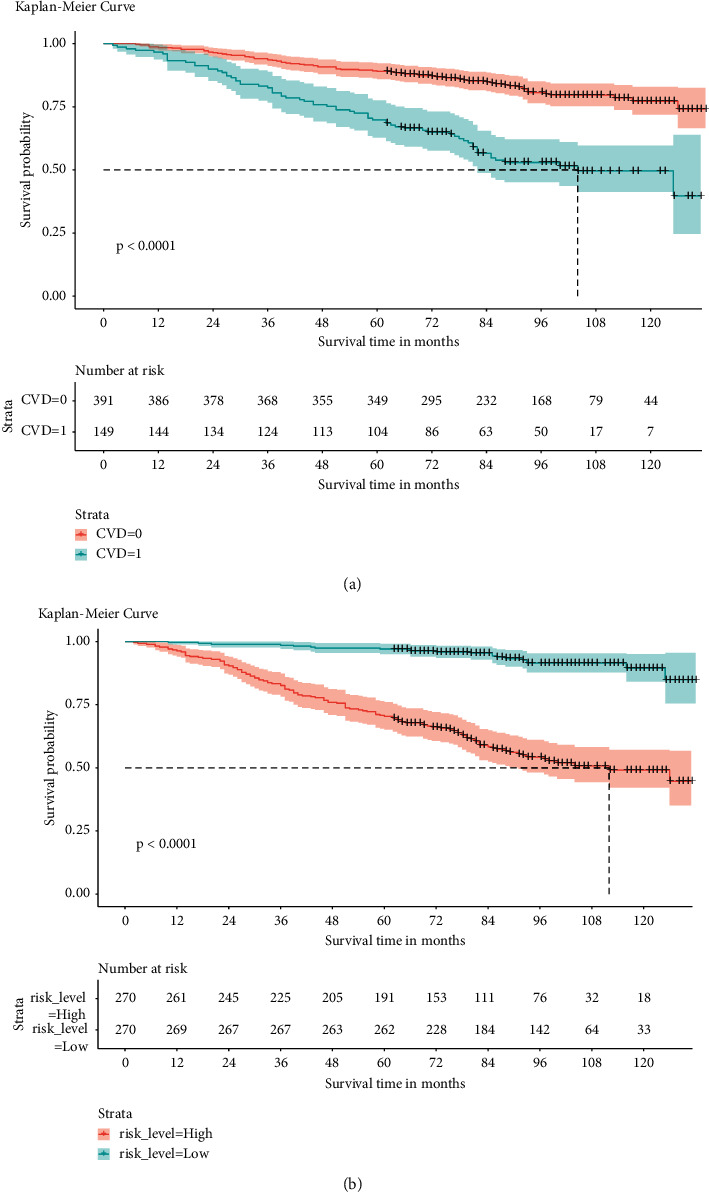
(a) Kaplan–Meier survival curves of CVD group in COPD. CVD = 0 means participants with COPD but without CVD, while CVD = 1 means participants with COPD coexisting with CVD. (b) Kaplan–Meier survival curves in high- and low-risk groups.

(a) Kaplan–Meier survival curves of CVD group in COPD. CVD = 0 means participants with COPD but without CVD, while CVD = 1 means participants with COPD coexisting with CVD. (b) Kaplan–Meier survival curves in high- and low-risk groups.