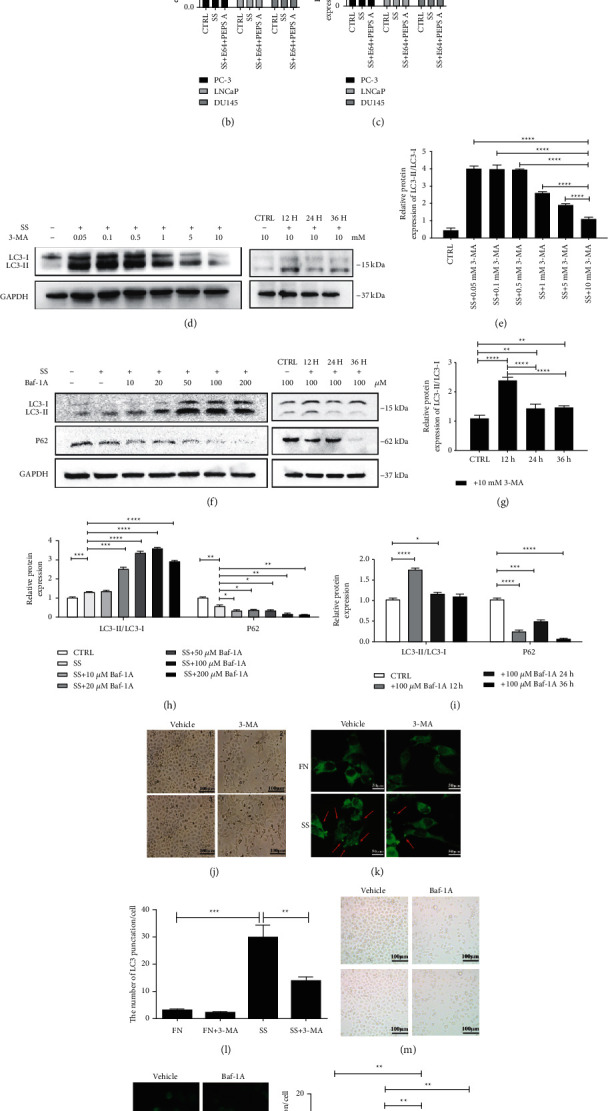
Figure 2.

Autophagy is activated in PCa cells. (a) Western blotting was used to detect the reduction of P62 and the ratio of LC3-II/LC3-I by serum starvation (SS) in PCa cells for 24 h with or without E64 and PEPS A. (b-c) Relative quantification of the protein expression of P62 and LC3-II/LC3-I in Figure 2(a). (d, f) Western blot results selected the best time and concentration of autophagy inhibition. (e, g, h, i) Relative quantification of the protein expression of LC3-II/LC3-I and P62 in Figures 2(d) and 2(f). (j, m) Cell morphology under a light microscope in FN or SS conditions after 10 mM 3-MA for 24 h or 100 μM Baf-A1 for 12 h. (k, n) PC-3 cells were transfected with pEGFP-C1-LC3 plasmid and cultured in FN or SS conditions and treated with 10 mM 3-MA for 24 h or 100 μM Baf-A1 for 12 h. A fluorescence microscope was used to film cells to determine the expression of LC3-II. Red arrows pointed to green puncta. (l, o) Quantification of the numbers of LC3 puncta/cell in Figures 2(k) and 2(n). ∗P < 0.05; ∗∗P < 0.01; ∗∗∗P < 0.001; and ∗∗∗∗P < 0.0001.
