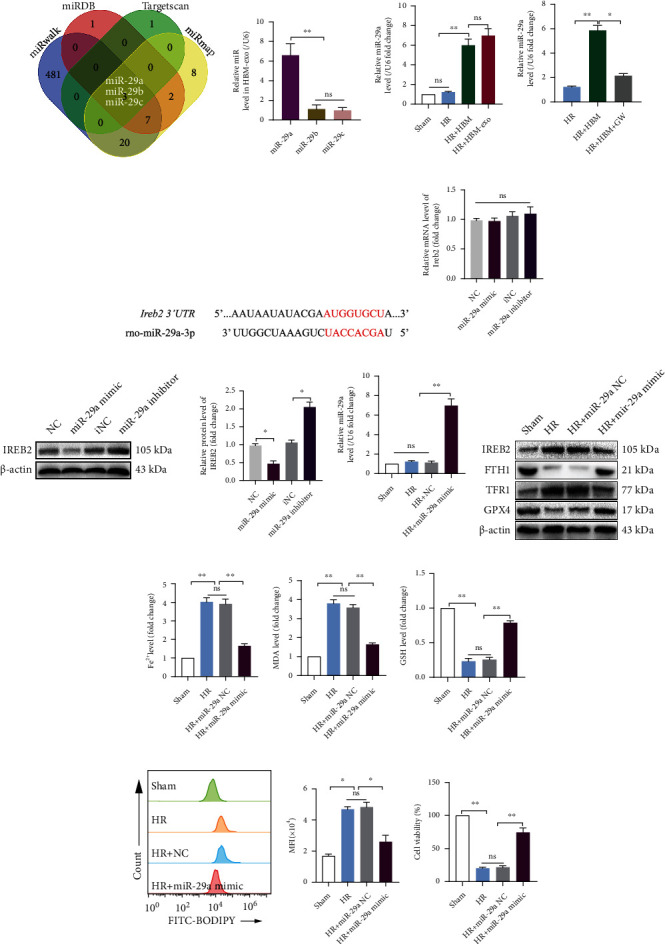
Figure 7.

miR-29a-3p, which targets Ireb2, is abundant in HBM-exos and could decrease IREB2 protein levels and inhibit ferroptosis. (a) miRNAs targeting the 3′-UTR of Ireb2 mRNA were predicted by TargetScan, miRWalk, miRDB, and miRmap databases. Finally, miR-29a-3p, miR-29b-3p, and miR-29c-3p were screened out using the four databases. (b) The level of miR-29a-3p was highest in HBM-exos. (c) The level of miR-29a-3p increased significantly in HBM-exos or HBM with the SHP-HR coculture system. (d) The miR-29a-3p level in the SHP-HR coculture system decreased significantly when HO-1/BMMSCs were treated with GW. (e) Pairing sequence of miR-29a-3p and 3′-UTR of Ireb2. (f) Neither the mimic nor the inhibitor of miR-29a-3p had a significant effect on the Ireb2 mRNA level. (g) The miR-29a-3p mimic significantly decreased the protein level of IREB2, and the miR-29a-3p inhibitor significantly increased the protein level of IREB2. (h) The level of miR-29a-3p in the HR + miR − 29a − 3p mimic group was significantly higher than that in the Sham, HR, and HR + NC groups. (i) IREB2/FTH1/TFR1/GPX4 protein levels detected using western blotting. (j) The Fe2+ level detected using colorimetry. (k) MDA content detected using colorimetry. (l) GSH content detected using colorimetry. (m) The lipid ROS level detected using C11-BODIPY and flow cytometry. Quantitative analysis of C11-BODIPY fluorescence intensity is shown on the right. (n) Cell viability detected using a CCK-8 kit. n = 3 per group. Data are presented as the mean ± SEM. ∗P < 0.05; ∗∗P < 0.01.
