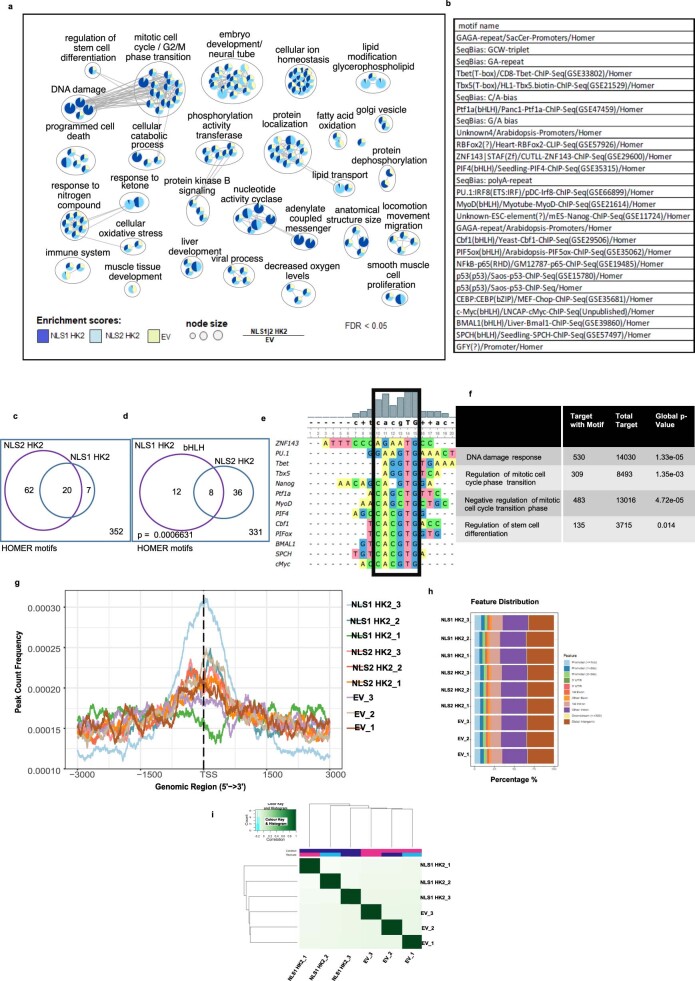
Extended Data Fig. 7. ChIP-seq of HK2 reveals a role in stem cell regulation and DNA damage response.
(a) Network representation of NLS1-HK2 and NLS2-HK2 ChIP–seq pathways with higher enrichment scores compared to EV. Node size is proportional to the ratio of NLS1/2 to EV at FDR < 0.05 using a Fisher’s exact test. (b) Known motifs from HOMER significantly enriched in both NLS1 and NLS2-HK2 peaks at FDR<0.05. (c) Venn plot showing significantly enriched motifs in NLS1 HK2 and NLS2 HK2 at FDR<0.05 using Fisher’s exact test. (d) Venn diagram shows bHLH motifs among the common HOMER motifs between NLS1 HK2 and NLS2 HK2. Fisher’s exact test p value for the enrichment of this motif is 0.0006631. (e) Multiple alignment of the motifs using the UGene tool showing the frequency of each nucleotide identifying the consensus sequence. (f) Enrichment of consensus sequence in the specified pathways. (g) Peak distribution around TSS of genes in each individual ChIP–seq biological replicates. (h) Peak distribution of individual replicates relative to promoters, intronic or intergenic regions. (i) Clustering on identical peaks using the DiffBind tool shows that NLS1-HK2 and EV group separately.

