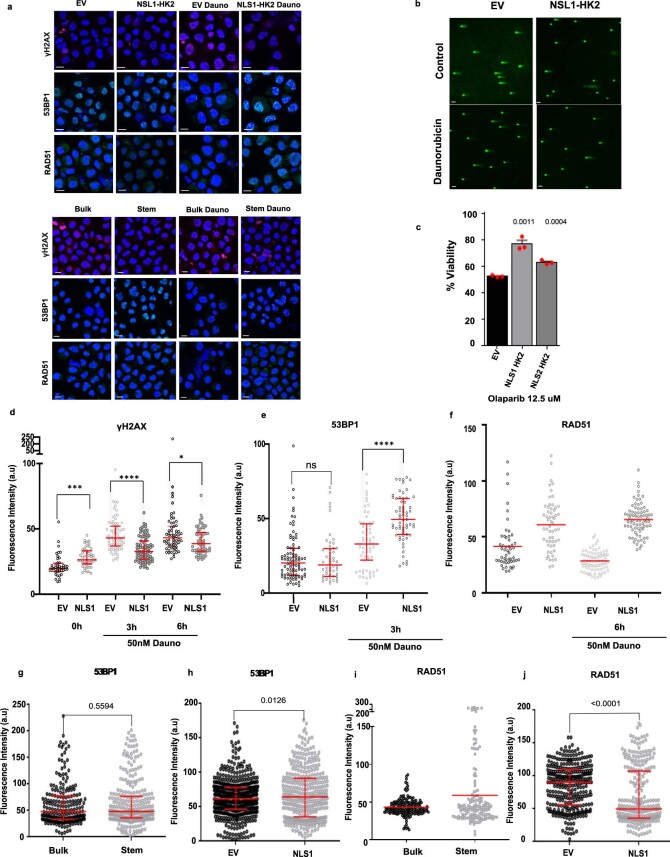
Extended Data Fig. 9. Nuclear HK2 enhances DNA repair.
(a) Representative confocal images of γH2AX and RAD51 expression at 6 hours, 53BP1 at 3 hours, in NLS1-HK2/EV transduced 8227 cells and sorted 8227 cells (stem/bulk) at baseline and after treatment with daunorubicin. Scale Bar = 10µm. Representative image from 3 biologic repeats. (b) Representative confocal images of comet assay in transduced 8227 cells. Scale bar = 70µm. Representative image from 3 biologic repeats. (c) Cell viability of EV, NLS1-HK2, NLS2-HK2 transduced NB4 cells after treatment with olaparib (12.5 µM) for 72 hours. n = 3 biologic repeats. (d) γH2AX levels were quantified by confocal microscopy in NLS1-HK2 NB4 cells after treatment with daunorubicin for 3 & 6 hours (50nM). n = 1536 cells examined over 3 biologic repeats. (e) 53BP1 levels were quantified by confocal microscopy after overexpressing NLS1-HK2 in NB4 cells and treating cells with daunorubicin for 3 hours (50nM). n = 1272 cells examined over 3 biologic repeats. (f) RAD51 levels were quantified by confocal microscopy in NLS1-HK2 NB4 cells after treatment with daunorubicin for 6 hours (50nM). n = 438 cells examined over 2 biologic repeats. (g) Baseline 53BP1 expression in 8227 stem and bulk controls. n = 510 cells examined over 3 biologic repeats. (h) Baseline 53BP1 expression in 8227 cells overexpressing NLS1- HK2. n = 879 cells examined over 4 biologic repeats. (i) Baseline RAD51 expression in 8227 stem and bulk controls . n = 331cells examined over 2 biologic repeats. (j) Baseline RAD51 expression in 8227 cells overexpressing NLS1- HK2. n = 671 cells examined over 3 biologic repeats. Statistical analyses for experiments was performed using an unpaired Student’s t-test. Data shown in (d-e, g-h, j) represent median and interquartile range, data from (c) represent mean +/- s.e.m, data from (f) represent mean.

