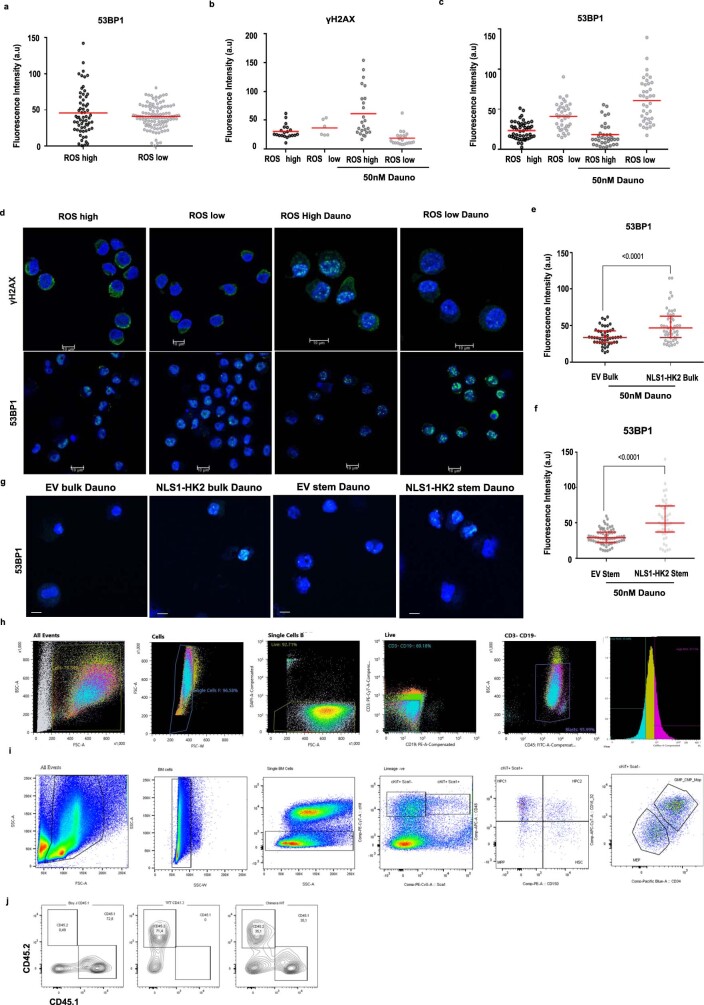
Extended Data Fig. 10. AML stem cells demonstrate enhanced DNA repair.
(a) Baseline 53BP1 expression in stem and bulk primary patient control cells (AML151258). n = 170 cells examined from 1 of 2 biologic samples. (b) γH2AX levels were quantified by confocal microscopy in stem and bulk fractions of primary patient cells (AML161820) after treatment with daunorubicin for 0 and 3 hours (50nM). n = 71 cells examined from 2 of 2 biologic samples. (c) 53BP1 levels in stem and bulk primary patient cells (AML161820) at baseline and after treatment with daunorubicin for 3 hours (50nM). n = 161 cells examined from 2 of 2 biologic samples. (d) Representative confocal images of γH2AX and 53BP1 in primary patient cells (AML151258) sorted into stem and bulk populations based on ROS levels at baseline and 3 hours after treatment with daunorubicin. Scale Bar = 10µm. Representative images from 1 of 2 biologic samples. (e) 53BP1 levels in EV and NLS1-HK2 transduced sorted bulk 8227 cells and (f) sorted stem cells after 3-hour treatment with daunorubicin (50nM). n = 203 cells examined from 3 biologic replicates. (g) Representative confocal images of 53BP1 in transduced sorted 8227 cells 3 hours after treatment with daunorubicin (50nM). Scale bar = 10µm Representative images from 3 biologic replicates. (h) Gating strategy for ROS high and ROS low AML patient samples. (i) Gating strategy for mouse bone marrow hematopoietic analysis. (j) Gating strategy for competitive repopulation assay. Statistical analyses for experiments was performed using an unpaired Student’s t-test. Data shown in (e-f) represent median and interquartile range, data from (a-c) represent mean.

