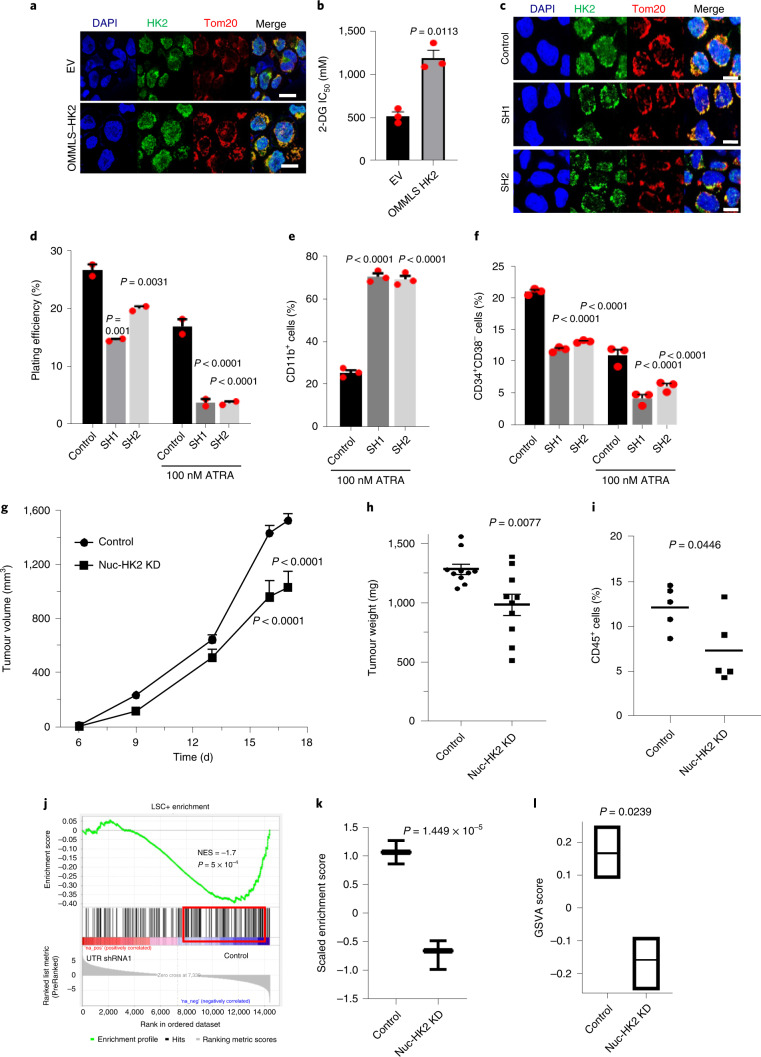
Fig. 2. Knockdown of nuclear HK2 reduces stem and progenitor cell function.
a, Confocal microscopy images of HK2 and Tom20 staining in NB4 cells 5 d after transduction with OMMLS–HK2 or EV. b, Half maximal inhibitory concentration (IC50) of 2-DG in OMMLS–HK2 and control NB4 cells 48 h after treatment. c, Confocal images of HK2 staining after transduction of OMMLS–HK2 NB4 cells with two shRNA (SH1 and SH2) targeting the untranslated region (UTR) of HK2. a,c, Scale bars,10 µm. Images are representative of n = 3 biological repeats. d, Clonogenic growth of OMMLS–HK2 NB4 cells transduced with shRNAs targeting the HK2 UTR and treated with ATRA (100 nM). e, Expression levels of CD11b in OMMLS–HK2 NB4 cells transduced with shRNA to the HK2-UTR and treated with ATRA (100 nM). f, Percentage of CD34+CD38− cells in 8227 cells transduced with OMMLS–HK2 and HK2-UTR shRNAs, in incubated with or without 100 nM ATRA for 24 h. b,d–f, n = 3 biological repeats. g, OCI-AML2 cells with selective nuclear HK2 knockdown or EV were subcutaneously injected into the flanks of SCID mice (n = 10 mice per group). Tumour volume was measured every alternate day for 18 d, starting 6 d after injection. h, OMMLS-HK2 AML2 cells were transduced with shRNAs targeting the HK2 UTR and subcutaneously injected into the flanks of SCID mice. The weights of subcutaneous tumours were measured at the end of the experiment (n = 10 mice per group). i, TEX cells with nuclear HK2 knockdown or EV were injected into the right femur of NOD/SCID-GF mice (n = 5 per group). Engraftment of TEX cells into the uninjected left femur was measured by flow cytometry 5 weeks post injection. j, GSEA of 8227 cells transduced with OMMLS–HK2 and shRNAs targeting the HK2 UTR. The NES and P values were analysed using a modified Kolmogorov–Smirnov test. k, Gene-set variation analysis score for LSC-positive gene signatures in 8227 cells transduced with OMMLS–HK2 and shRNAs targeting the HK2 UTR. Control: minimum, 0.8600; maximum, 1.271; and median, 1.066. SH1: minimum, −0.9867; maximum, −0.4826; and median, −0.6619. l, Gene-set variation analysis (GSVA) score for HSC gene signatures in 8227 cells transduced with OMMLS–HK2 and shRNAs targeting the HK2-UTR. Control: minimum, 0.09000; maximum, 0.2500; and median, 0.1700. SH1: minimum, −0.2500; maximum, −0.09000; and median, −0.1500. k,l, In the box-and-whisker plots, the horizontal lines mark the median, the box limits indicate the 25th and 75th percentiles, and the whiskers extend to 1.5× the interquartile range from the 25th and 75th percentiles. b,d–i,k,l, Statistical analyses were performed using a two-tailed unpaired Student’s t-test (b,h,i,k,l) and ordinary one-way (d–f) or two-way (g) analysis of variance (ANOVA) with Sidak’s multiple comparison test; P values for comparisons to the control are provided. Data represent the mean ± s.e.m. Nuc-HK2 KD, nuclear HK2 knockdown.

