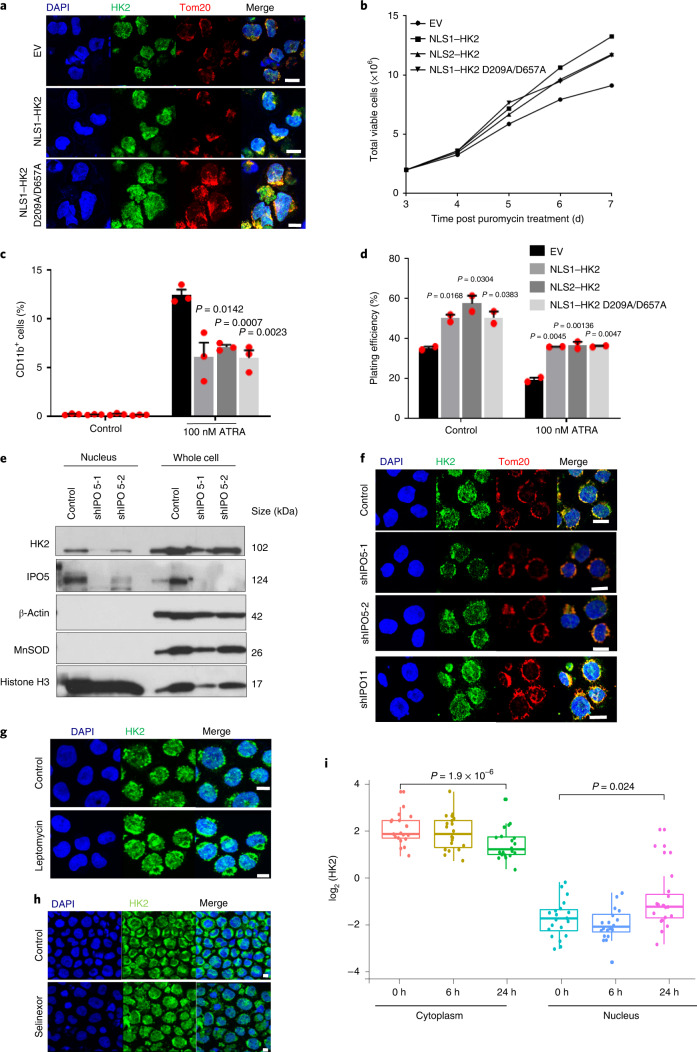
Fig. 4. Nuclear HK2 maintains stemness independently of its kinase activity and is mediated by active import/export.
a, Confocal microscopy images of HK2 and Tom20 staining in NB4 cells 5 d after transduction with NLS1–HK2, the kinase-dead NLS1–HK2 D209A/D657A mutant or EV. b, Cell viability of NB4 cells after transduction with NLS1–HK2, NLS2–HK2 or NLS1–HK2 D209A/D657A; n = 2 biological repeats. c, Expression of CD11b in NB4 cells transduced with NLS1–HK2, NLS2–HK2 or NLS1–HK2 D209A/D657A and treated with ATRA (100 nM); n = 3 biological repeats. d, Clonogenic growth of NB4 cells transduced with NLS1–HK2, NLS2–HK2 or NLS1–HK2 D209A/D657A and treated with ATRA (100 nM); n = 3 biological repeats. e, Immunoblot analysis of HK2 in the nuclear and whole-cell lysates of NB4 cells treated with shRNAs targeting IPO5. f, Confocal microscopy images of HK2 and Tom20 in NB4 cells after IPO5 (shIPO5-1 and shIPO5-2; second and third rows) and IPO11 (shIPO11; bottom) knockdown using shRNA. g,h, Representative confocal images of HK2 and Tom20 in NB4 cells treated with the XPO1 inhibitors leptomycin (g) and selinexor (h). i, HK2 expression in the cytoplasmic and nuclear fractions of various leukaemic cell lines (n = 20) following treatment with the XPO1 inhibitor KPT185 for 6 or 24 h, determined using RPPA analysis. Cytoplasm 0 h: minimum, 0.6462; maximum, 3.5142; and median, 1.6358. Nucleus 0 h: minimum, −3.5388; maximum, −0.5461; and median −2.1901. Cytoplasm 6 h: minimum, 0.4226; maximum, 3.5298; and median, 1.622. Nucleus 6 h: minimum, −4.130; maximum, −1.025; and median, −2.552. Cytoplasm 24 h: minimum, 0.0185; maximum, 3.1735; and median, 0.9156. Nucleus 24 h: minimum, −3.334; maximum, 1.817; and median, −1.1624. In the box-and-whisker plots, the horizontal lines mark the median, the box limits indicate the 25th and 75th percentiles, and the whiskers extend to 1.5× the interquartile range from the 25th and 75th percentiles. a,e–h, Images are representative of three biological repeats. a,f–h, Scale bars, 10 µm. c,d, Data represent the mean ± s.e.m. c,d,i, Statistical analyses were performed using a two-tailed unpaired Student’s t-test (c,d) or a paired Wilcoxon rank-sum test.

