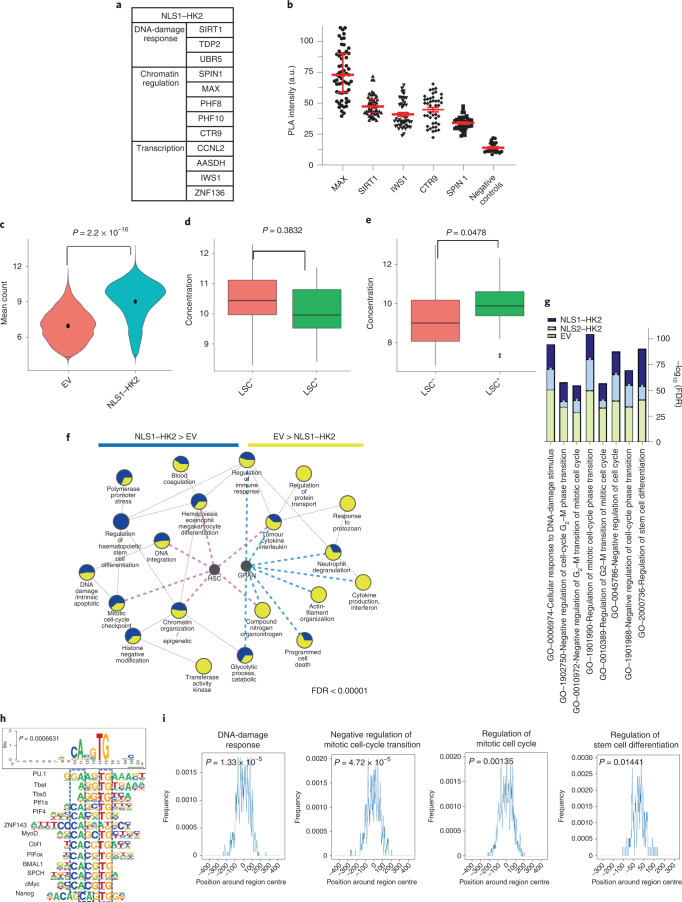
Fig. 5. Nuclear HK2 modulates chromatin accessibility and is involved in the maintenance of DNA integrity.
a, Proteins that interact with NLS1–HK2, as determined by BioID coupled with mass spectrometry; n = 3 biological repeats. b, Intensity of the PLA signal of endogenous HK2 and MAX, SIRT1, IWS1, CTR9 and SPIN1 in NB4 cells. A.u., arbitrary units; n = 278 cells from three biological repeats. c, Chromatin accessibility, measured through ATAC-seq, following overexpression of NLS1–HK2 in NB4 cells; n = 3 biological repeats. d, LSC+ and LSC− signatures in EV control NB4 cells. LSC−: minimum, 5.15; maximum, 12.81; and median, 8.27. LSC+: minimum, 5.990; maximum, 12.030; and median, 9.325. e, LSC+ and LSC− signatures in NLS1–HK2 NB4 cells. LSC−: minimum, 6.840; maximum, 13.010; and median, 9.020. LSC+: minimum, 7.300; maximum, 12.340; and median, 9.895. f, ATAC-seq pathway enrichment analysis in EV control and NLS1–HK2 NB4 cells. The size of the pie chart slices is proportional to the FDR score, −log10(FDR), for each of the gene lists. Blue and pink lines pinpoint to pathways that overlap significantly with the HSC and granulocyte (GRAN) gene lists at FDR < 0.05 according to a Fisher’s exact test. g, Enhanced enrichment of the pathways in NLS1–HK2 and NLS2–HK2 ChIP–seq compared with EV control ChIP–seq in NB4 cells. h, Consensus motif identified by HOMER DNA-binding-motif analysis significantly enriched in NLS1– and NLS2–HK2 peaks at FDR < 0.05. The P value shows significant enrichment of bHLH motifs, determined using a Fisher’s exact test. The boxes with the dashed lines represent sequence similarity overlap. i, Enrichment of the consensus motif CACGTG in sequences of peaks associated with the selected pathways. The hypergeometric P value estimated using the Fisher’s exact test indicate the significance of the enrichment of the motif when compared with random sequences. c–e, Statistical analyses were performed using a two-tailed unpaired Student’s t-test. Data represent the mean ± s.e.m. d,e, In the box-and-whisker plots, the horizontal lines mark the median, the box limits indicate the 25th and 75th percentiles, and the whiskers extend to 1.5× the interquartile range from the 25th and 75th percentiles.

