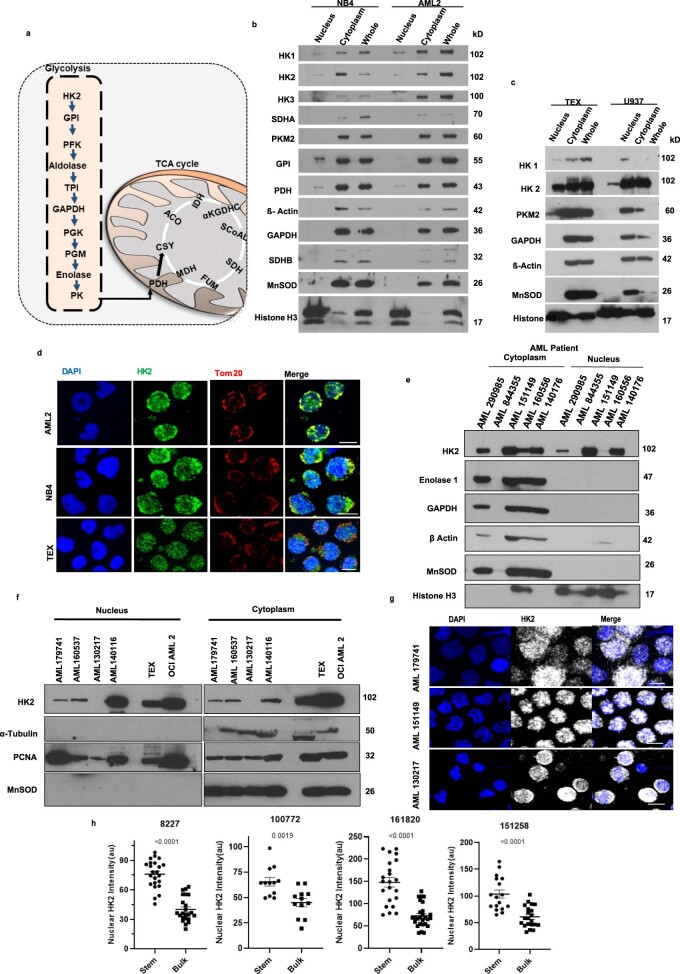
Extended Data Fig. 1. HK2 localizes to the nucleus in AML.
(a) Diagram of the glycolytic and TCA cycles. (b) Immunoblot analysis of glycolytic and TCA cycle metabolic enzymes in nuclear, cytoplasmic and whole-cell lysates of (b) OCI-AML2 and NB4 cells & (c) TEX and U937 cells. Representative immunblot from 3 biologic repeats. (d) Representative confocal microscopy images of HK2 (green) and Tom20 in AML2, NB4 and TEX cells. Scale bar = 10µm. Representative immunblot from 3 biologic repeats. (e) Expression of HK2 and the related glycolytic enzymes, enolase and GAPDH, by immunoblotting in cytoplasmic and nuclear fractions of primary AML patient samples n = 5 biologically independent samples. (f) Expression of HK2 by immunoblotting in cytoplasmic and nuclear fractions of primary AML patient samples. n = 4 biologically independent samples. (g) Representative confocal microscopy images of HK2 (white) in AML patient samples. Scale bar = 10µm. n = 3 biologically independent samples. (h) Fluorescence intensity analysis in 8227 cells and AML patient samples, separated into stem and bulk populations. n = 165 cells examined from 4 biologically independent samples. Statistical analyses for all experiments was performed using a two-tailed unpaired Student’s t-test. Data shown represent mean +/- s.e.m.

