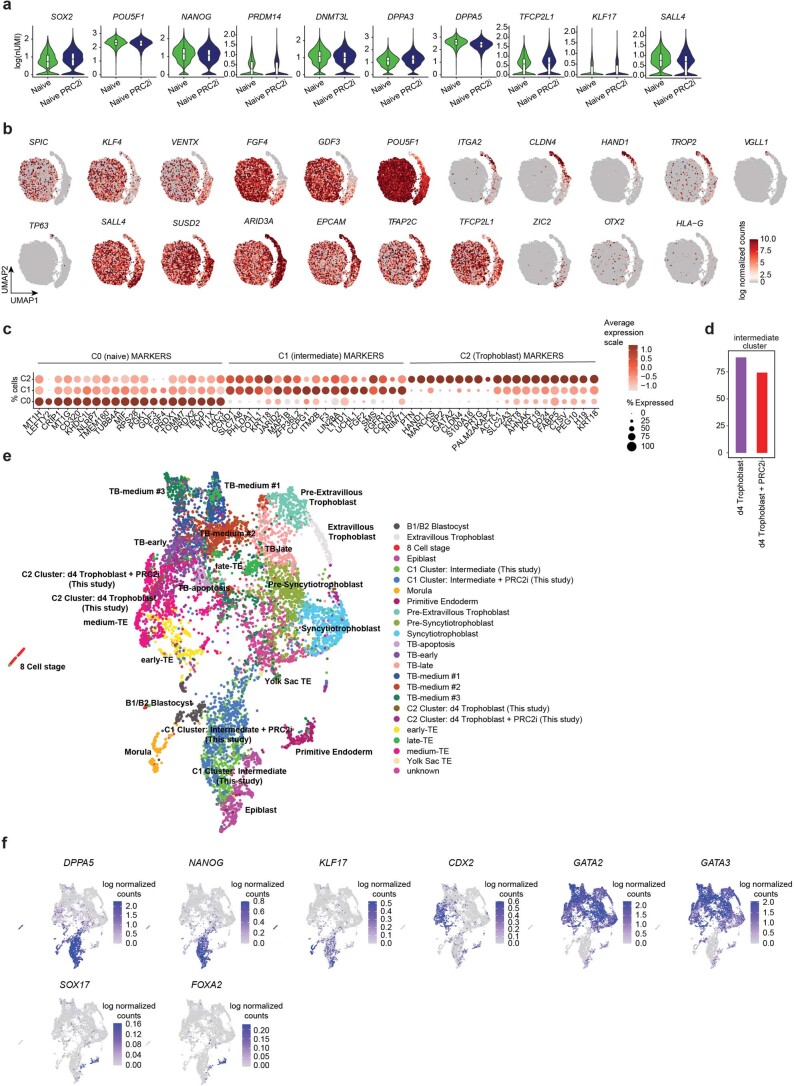
Extended Data Fig. 6. Integration with human embryo data.
a. Violin plots with single cell expression distributions combined with boxplots in naive hiPSCs with and without PRC2i of pluripotency-associated genes. Data are visualized as log(nUMI). The boxplots show the interquartile range (box limits) and median (centre line) of gene expression levels. Number of single cells measured: n = 2,903 cells for the naive sample, and n = 3,338 cells for the naive + PRC2i sample. b. scRNA-seq analysis of pluripotency-associated and trophoblast-associated genes (UMAPs). Data are visualized as log normalized counts. Darker red intensity represents higher levels of gene expression, while lower red represents lower gene expression levels. c. scRNA-seq analysis showing the 20 most differentially expressed genes between the naive, intermediate and trophoblast cell clusters. Point size represents the proportion of cells in the cluster with the indicated gene expression enrichment. Data are visualized as average expression scale. Darker red intensity represents higher levels of gene expression, while softer red represents lower gene expression levels. d. Proportion of day 4 converted cells with intermediate cell identity. Purple indicates the day 4 trophoblast and red indicates the day 4 + PRC2i samples. e. Single-cell UMAP representation comparing in vitro day 4 trophoblast and day 4 trophoblast + PRC2i with human pre-implantation3 and postimplantation74 by data integration. Annotations from13. f. Single-cell UMAP representation of pluripotency, trophoblast and primitive endoderm marker genes from data in e. Data are visualized as log normalized counts. Underlying source data is provided in Source Data Extended Data Fig. 6.

