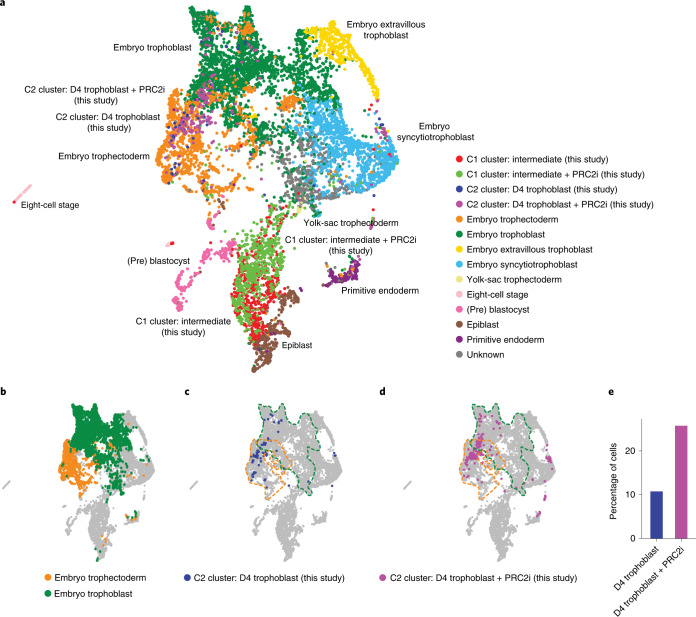
Fig. 6. Evaluation of differentiation by comparison with human embryo data.
a, UMAP projection of the human pre-implantation and postimplantation embryo integration with day 4 (D4) in vitro trophoblast conversion with and without PRC2i. Human embryo data from3,74. b, UMAP projection of embryo trophectoderm and embryo trophoblast on the UMAP from a. c,d, UMAP projection of D4 trophoblast cells in C2 with (d) and without (c) PRC2i treatment projected on the UMAP from a. The clusters correspond to those in Fig. 5d–f. Dotted lines represent the embryo trophectoderm (orange) and embryo trophoblast (green) as shown b. e, Proportion of D4 trophoblast conversion cells, with and without PRC2i, that were categorized as belonging to the C2 trophoblast cluster. Source data are provided.

