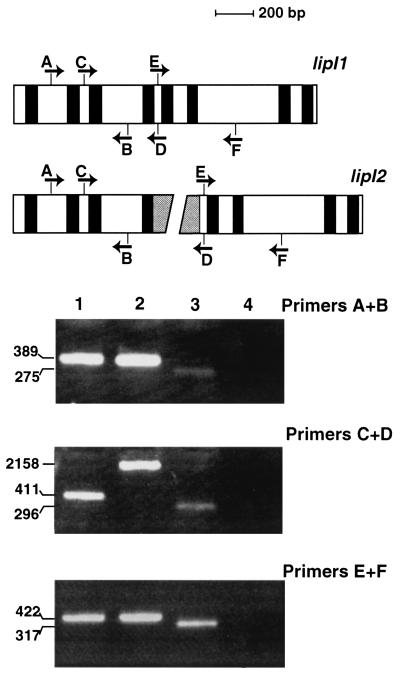
FIG. 1.
Analysis of lipI transcripts. At the top, a schematic representation of lipI alleles shows the locations of introns (black fill), Pce1 (gray fill), and the primers designated A through F (arrows indicate direction of transcription. Ethidium bromide-stained PCR products size fractionated on agarose gels are shown at the bottom. Lanes 1 and 2 are controls, showing amplification products from cosmid templates carrying lipI1 and lipI2, respectively. RT-PCR products from RNA derived from Aspen wood chip cultures inoculated with BKM-F-1767 and RP-78 are shown in lanes 3 and 4, respectively. No RT-PCR amplification product was obtained from the RP-78 RNA (lane 4). In contrast, BKM-F-1767 cultures contained the expected lipI transcript (lane 3). The sizes of the PCR products (in nucleotides) are shown on the left.

