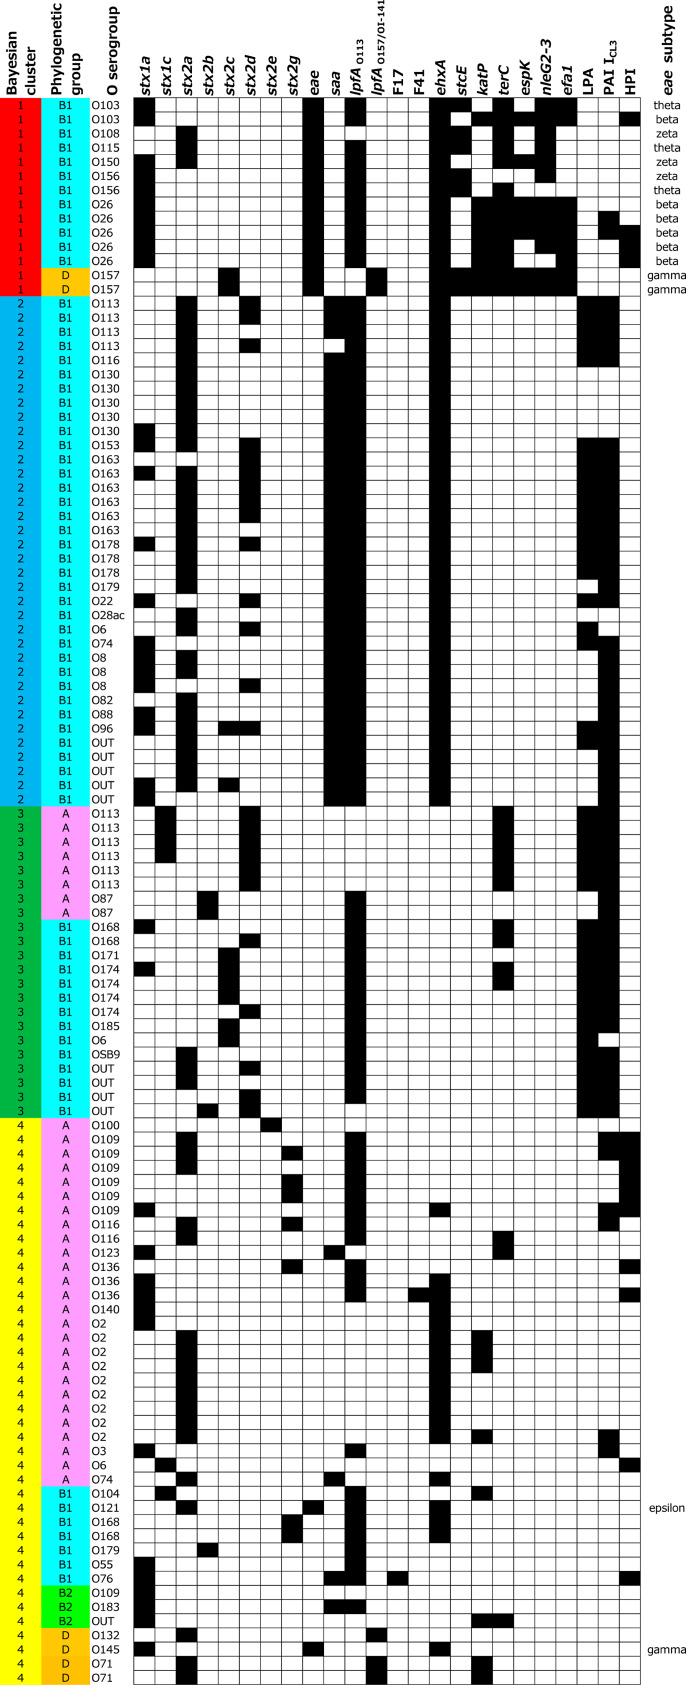
Fig. 1.
Bayesian clustering results of STEC isolated from cattle in Japan. Each cluster or phylogenetic group is highlighted by a different color in the first and second columns. The distribution of virulence markers is shown in columns 4–27; black = presence; white = absence. The results for stx1d, stx2f, bfpA, aggR, f5, fedA, clpG, and Eib are omitted because no isolate was positive for these markers.

