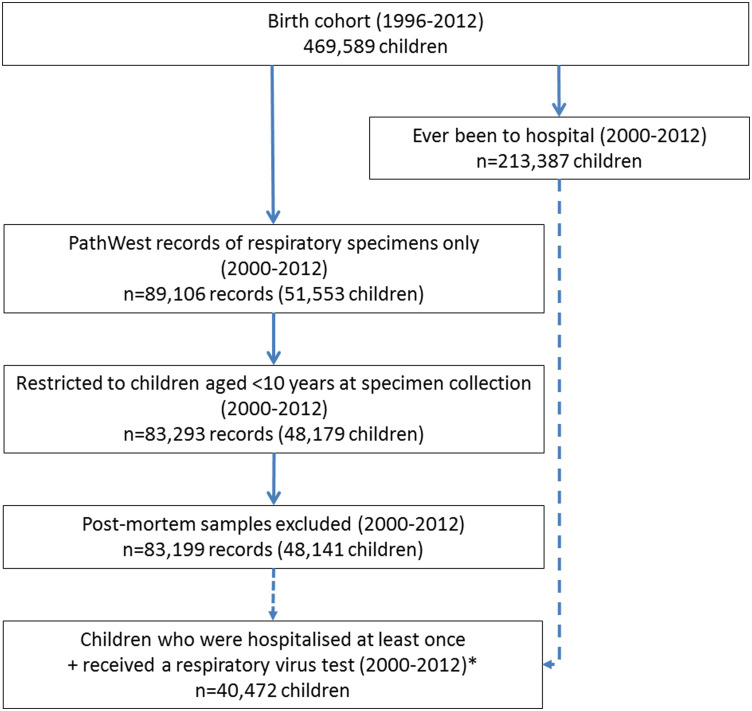
Fig. 1.
Flow chart of data cleaning and cohort. Legend: solid arrow denotes that the latter dataset is a subgroup of the prior dataset. Dashed arrows denotes that the prior dataset feeds into the latter dataset. *Only data from this subgroup of children were used to generate results for Table 2. PathWest, PathWest Laboratory Medicine WA Database.

