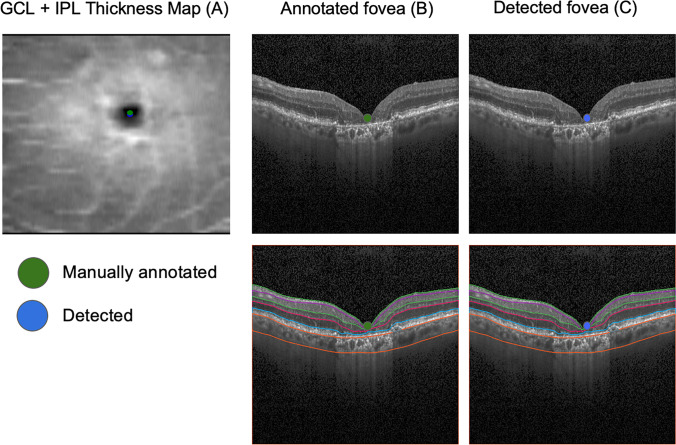
Fig. 3.
Qualitative analysis of the results. The figures illustrate an example of high correspondence between manual (green dot) and detected (blue dot) foveal location. On the left panel (A), it is possible to appreciate the two foveal localizations on the GCL-IPL thickness map (0.049 mm error). Manual foveal annotation on the SD-OCT standard b-scan (B, above) and the corresponding layer segmentation (B, below) and detected foveal annotation on the SD-OCT standard b-scan (C, above) and the corresponding layer segmentation (C, below). [GCL, ganglion cell layer; IPL, inner plexiform layer; SD-OCT, spectral-domain optical coherence tomography]

