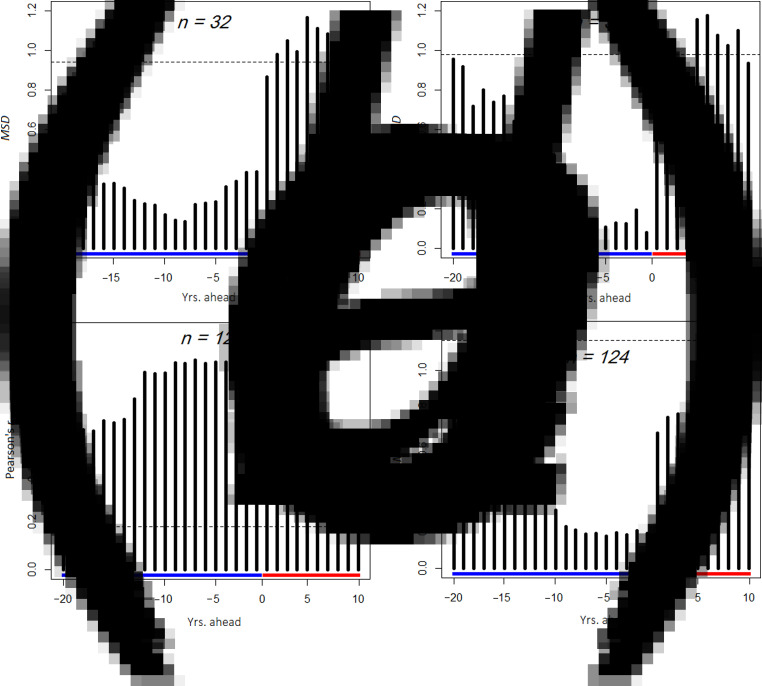
Fig. 2.
Prediction accuracy of the harmonic regression model: each bar represents n pairs of actual and predicted incidences, dotted lines show thresholds of statistical significance (P = 0·05), and negative and positive values on the time axis correspond to training data and forecast, respectively. Upper panels: comparison of an (a) unweighted and (b) weighted model (R = 3·0) with the Czech data as an example; note that weighting improves accuracy around the end of the training segment including the years +1 to +4. Lower panels: average prediction accuracy across all models expressed in terms of (c) r, and (d) MSD.

