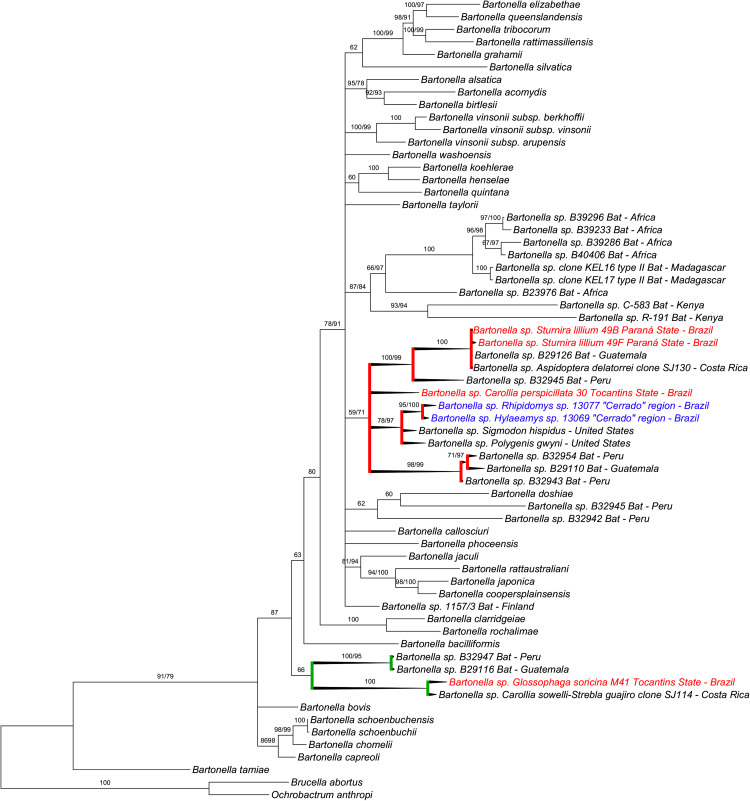
Fig. 2.
Concatenated phylogenetic analysis of Bartonella nuoG and gltA sequences (3370 bp after alignment) based on the topology generate on the BI method. The values of support of posterior probability/bootstrap higher than 50% are shown in each branch. The sequences of the present work were highlighted in red composing two different clusters. One comprising three sequences of the present study (red branches) clustering with sequences obtained from bats from Guatemala and Peru and from rodents sampled in Brazil (sequences highlighted in blue) and in the USA with a 59/71% of probability. The other cluster (green branches) comprises one sequence obtained in the present study with sequences obtained from bats sampled in Costa Rica, Peru, and Guatemala, with 66% of probability. Brucella abortus and Ochrobactrum anthropi were used as outgroups.

