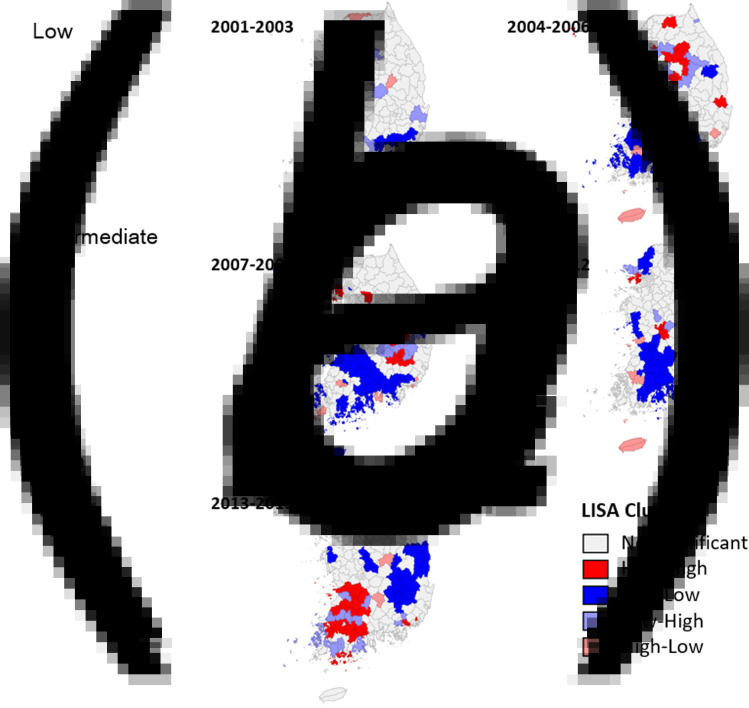
Fig. 2.
Cluster map of mumps incidence during the three periods in the Republic of Korea: (a) low (2001–2006), (b) intermediate (2007–2012), and (c) high endemicity (2013–2015). Hot spots, marked with red color, are the regions where prevalence of self and neighboring regions were all high; cold spots, marked with blue color, are the regions where prevalence of self and neighboring regions were all low.

