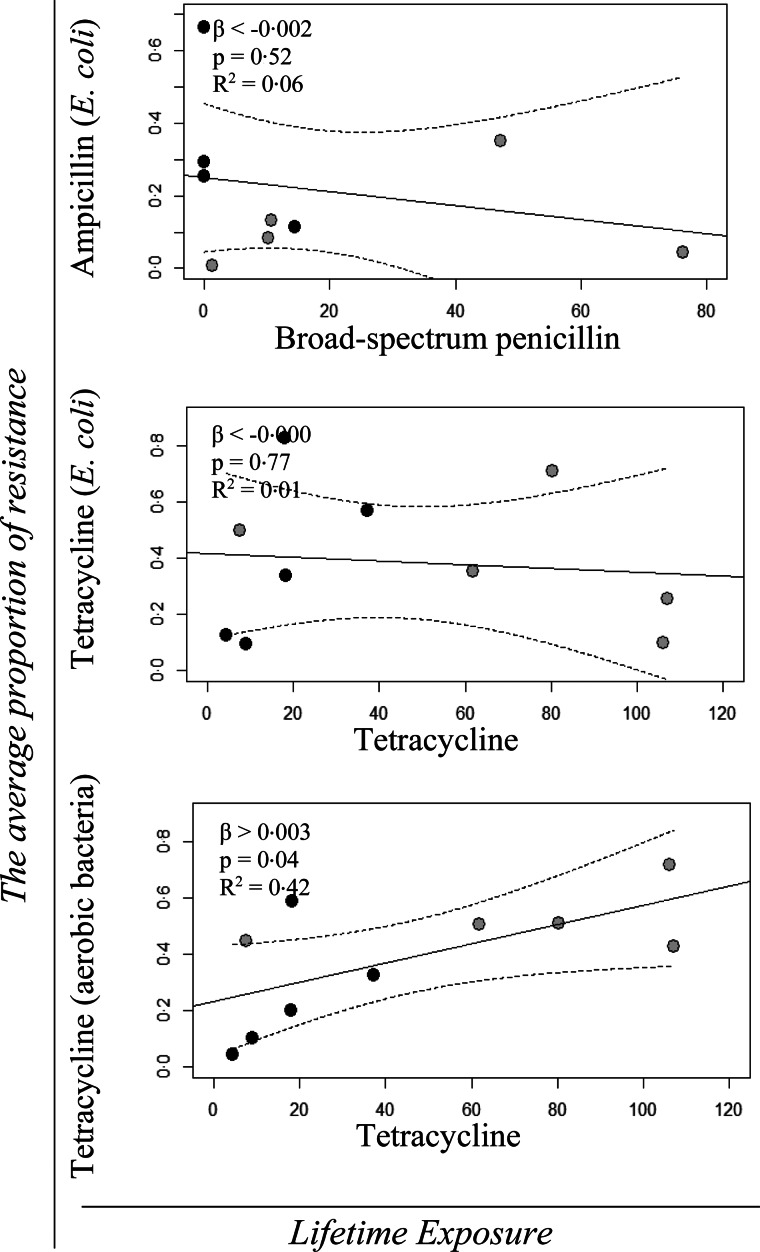
Fig. 5.
Univariable linear regression plots (solid line) and 95% confidence interval (dotted lines) of the average resistance proportion of ampicillin and tetracycline resistance from cultivation of Escherichia coli on MacConkey agar with and without ampicillin and tetracycline, as a function of Lifetime Exposure for the AM classes; broad-spectrum penicillin and tetracycline, respectively, and the average resistance proportion of tetracycline resistance from cultivation of aerobic bacteria on LB agar with and without tetracycline, as a function of Lifetime Exposure for the AMc; tetracycline. The grey points denote the initially high users and the black points depict the initially low users. The effect (β), the P-value (P) and the R2 value are shown in the top left corner of each model.

