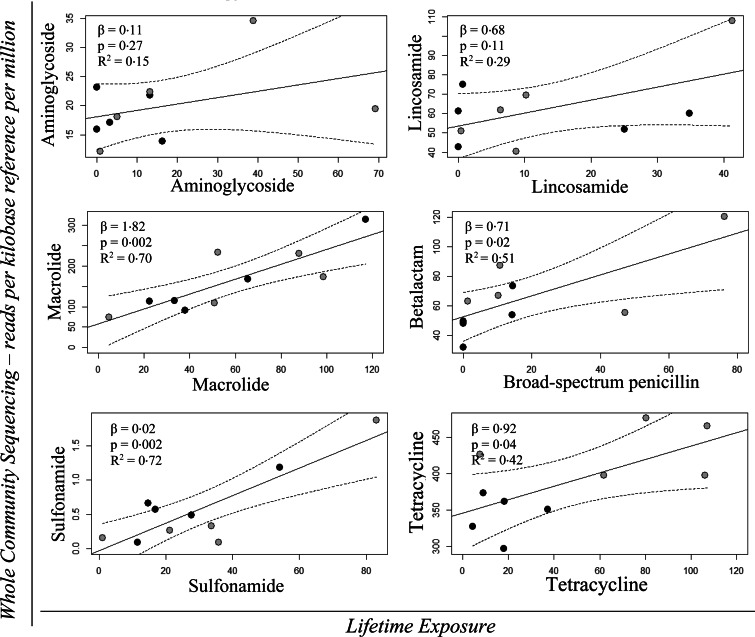
Fig. 6.
Univariable linear regression plots (solid line) with 95% confidence interval (dotted lines) of WCS – RPKM of the AMR genes for: aminoglycoside, lincosamide, macrolide, β-lactam, sulfonamide and tetracycline as a function of Lifetime Exposure for the AM classes: aminoglycoside, lincosamide, macrolide, broad-spectrum penicillin, sulfonamide and tetracycline, respectively. The grey points denote the initially high users and the black points depict the initially low users. The effect (β), the P-value (P) and the R2 value are shown in the top left corner of each model.

