Figure 2.
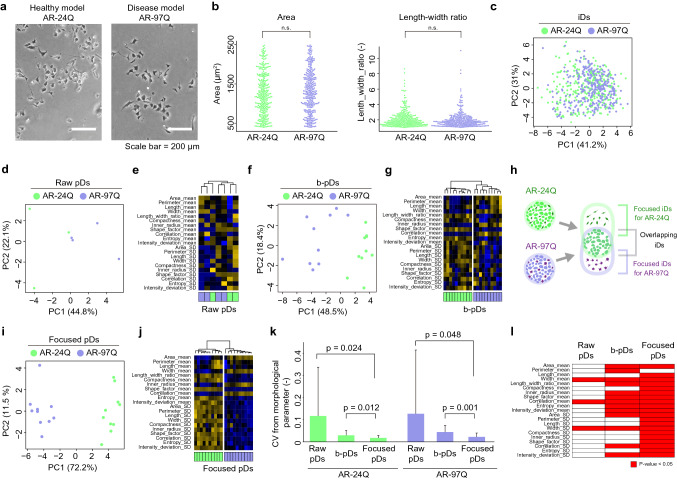
Evaluation of morphological heterogeneities and in silico featured-objects concentrated by anomaly discrimination from unit space (in silico FOCUS) analysis using model cells. (a) Representative image of model cells (healthy model, AR-24Q cells; disease model, AR-97Q cells). (b) Morphological distribution of 300 cells described by a single parameter. n.s. non-significant (N = 300). (c) Principal component analysis (PCA) of 100 cells described by 14 morphological parameters. (d, e) PCA and clustering of raw population data (raw pDs) (3 wells). (f, g) PCA and clustering of pDs with bootstrap (b-pDs) (N = 10). (h) Schematic illustration of in silico FOCUS applied to compare model cells. (i, j) PCA and clustering of pDs from in silico FOCUS (focused pDs;10 samples). (k) Evaluation of in silico FOCUS effect using variance of morphological parameters among pDs (Fig. S9a). p < 0.05 is indicated in the plot (N = 27). The bar plots indicate the mean of 27 coefficient of variations (CVs). Error bars indicate standard deviation. (l) Evaluation of in silico FOCUS effect using various morphological parameters that were significant (p < 0.05) between AR-24Q and AR-97Q (N = 10). All illustrations created by Adobe Illustrator 24.1.1 (https://www.adobe.com/jp/products/illustrator.html).

