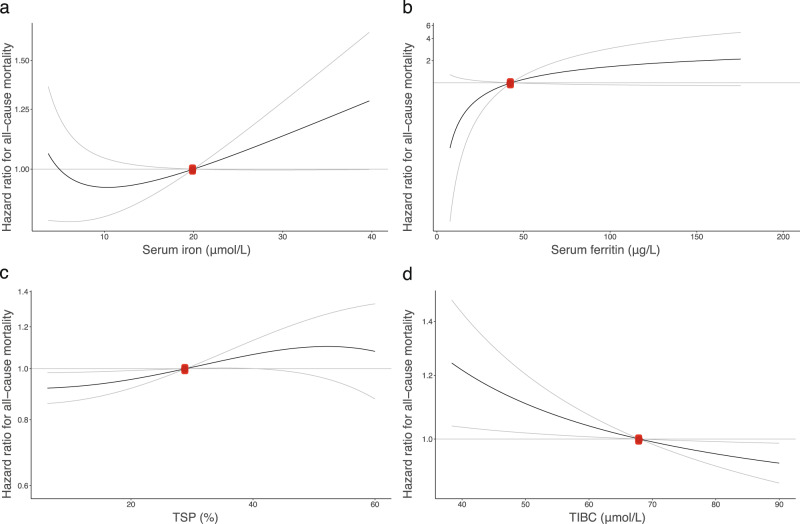
Fig. 2. Non-linear Mendelian Randomization: causal associations between iron status biomarkers and all-cause mortality.
Dose-response curves (black) between iron traits and all-cause mortality in HUNT (gray lines give 95% confidence interval). The x-axis gives a: serum iron levels (µmol/L) [N = 56,654], b: serum ferritin (µg L−1) [N = 2335], c: transferrin saturation (%) [N = 56,651] and d: total iron-binding capacity (TIBC) (µmol L−1) [N = 56,654]. The y-axis gives the hazard ratios for all-cause mortality with respect to the reference values (red dot), which represent the established target values (iron, TIBC, TSP)84 or median value (ferritin) for the traits. The curve gradients represent the localized average causal effect at each point. N = sample size.

