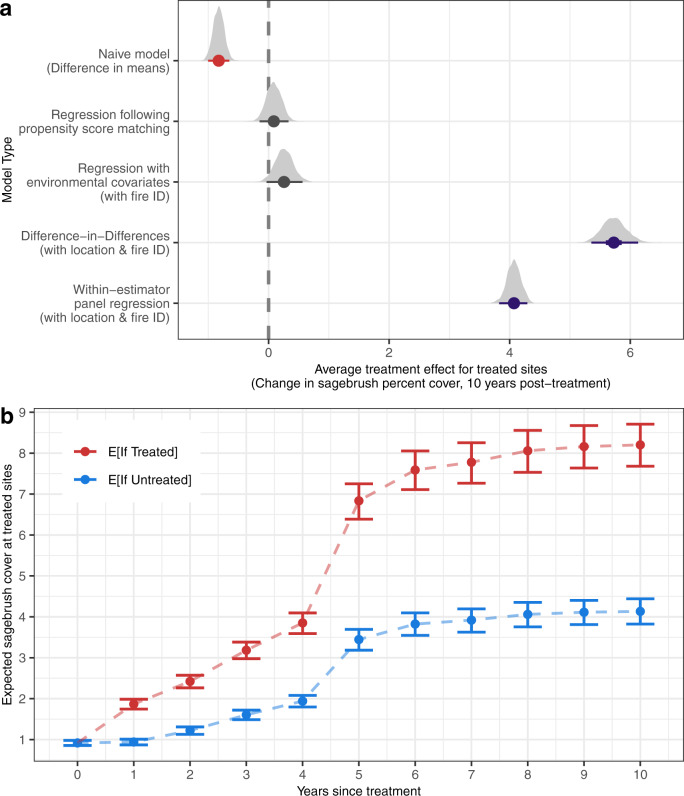
Fig. 4. Variation in estimated treatment effects among statistical approaches.
a The predicted treatment effects (for treated sites) of post-fire sagebrush seeding on sagebrush cover, identified by five statistical approaches: (1) a naïve model examining only the difference in means between treated and untreated sites; regression analyses that incorporate either (2) propensity score matching or (3) environmental covariates, which considered measured sources of bias; (4) DiD estimation, which considered time-invariant unmeasured sources of bias; and (5) within-estimator panel regression, which additionally considered time-varying unmeasured factors. Dots represent median estimates, lines represent the 95% credible intervals (CIs), and grey density plots indicate full posterior. Red, grey, and purple intervals indicate negative, neutral, and positive estimated effects of restoration treatments on sagebrush recovery, respectively. b The expected (E[]) trajectories of sagebrush recovery if treated sites were to receive or not receive seeding treatments, over the 10 years following treatment. Dots indicate median estimates with 95% credible interval bars. Prediction intervals are constructed from posterior draws of the linear predictor for the within-estimator panel model, while holding weather covariates at their means.

