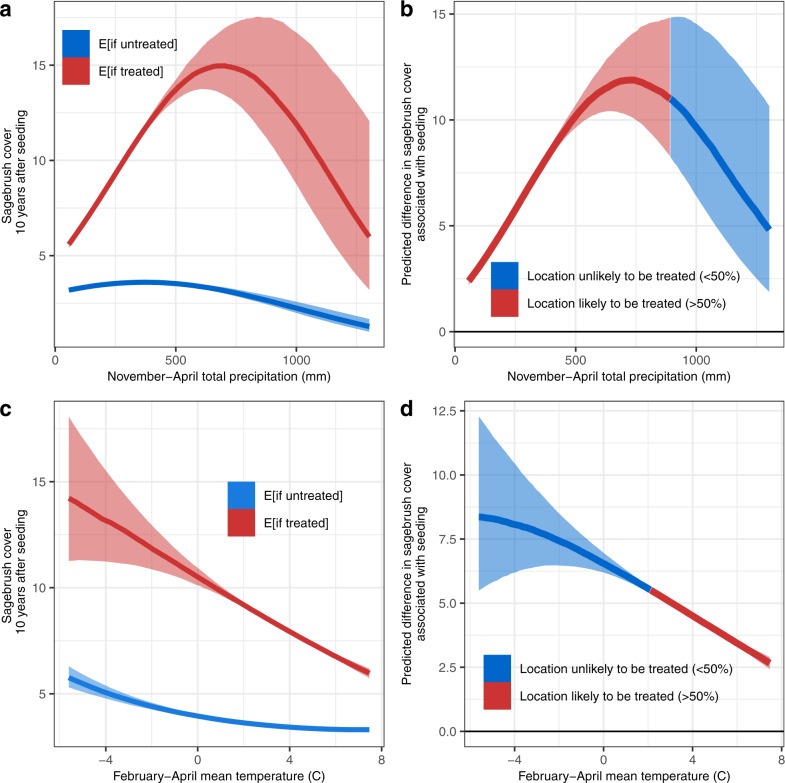
Fig. 5. Variation in the effects of seeding treatments across climatic gradients.
Panels show sagebrush percent cover (%) 10 years following fire (shown for the Central Basin and Range Ecoregion), along gradients of (a, b) November-April total precipitation (30-year average) and (c, d) February-April mean temperature (30-year average). Panels on the left (a, c) illustrate the expected (“E”) of sagebrush cover for sites in the treated group, if they were to either receive or not receive treatment (median expectations, shown with 50% credible intervals). Panels on the right (b, d) illustrate the difference in sagebrush recovery observed when treatment is applied (median expectations, shown with 50% credible intervals). Positive values (above the solid line at 0) indicate gains associated with reseeding; line color indicates whether restoration is likely (>50% probability of occurrence) or unlikely (<50%) to occur at given precipitation (b) or temperature (d) conditions, based on the model of treatment probability (see Figs. 2, 3). Posterior parameter estimates for all covariates included in the associated model (n=20,000 locations) can be found in Supplementary Fig. 5.

