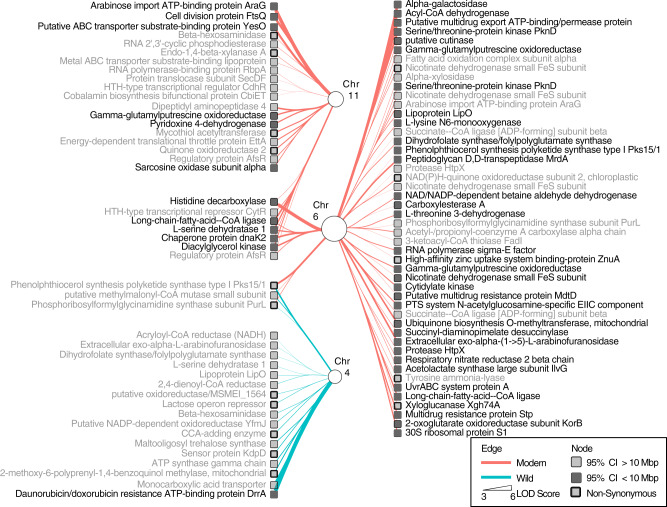
Fig. 7. The SNP QTLs identified in the Streptomyces contigs mapping to the previously identified positions on chromosomes 4, 6, and 11.
The figure depicts various features of both the QTL analysis and the SNP. In particular, the edge sizes are relative to the LOD score, and edge color is coded by modern and wild. SNPs are represented by square nodes. Those with confidence intervals <10 Mbp are shaded in dark. Non-synonymous SNPs have a thick border edge. Annotations are provided next to the genes. Source data are provided as a Source Data file.

