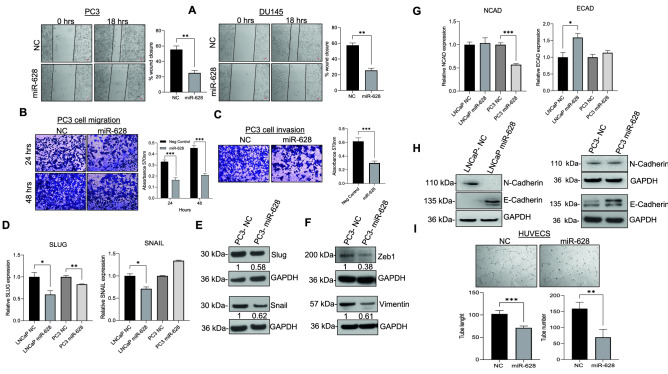
Figure 6.
MiR-628 expression affects PCa cell migration, invasion, and tube formation in PCa and HUVEC cells. (A) Cell motility assay (scratch assay) was performed in PC3 and DU145 cells transfected with miR-628 (100 nM) or NC (100 nM) (representative images, left panels) and scratch closure was quantified after 18 h using ImageJ (right panels; **p < 0.01). (B) Transwell cell migration was assessed in PC3 cells transfected with miR-628 or NC. Representative images are shown in upper panels taken at 10X magnification with a light microscope. Absorbance (562 nm) was determined at 24 and 48 h (lower panels) as described in the material and method section. ***p < 0.001. (C) Cell invasion assay assessed in PC3 cells transfected with miR-628 (100 nM) or NC (100 nM) (upper panels) and absorbance (562 nm) was determined at 48 h (lower panels; ***p < 0.001). Images were taken at a 10X magnification with a light microscope. (D) The effect of miR-628 on the expression of SLUG and SNAIL expression was measured by RT/qPCR in LNCaP and PC3 cells after transfection with 100 nM of miR-628 mimic or NC. *p < 0.05, **p < 0.01. (E) Protein expression of Slug and Snail are shown in PC3 cells after transfection with 100 nM of miR-628 mimic or NC and imaged using film. (F) Protein expression of Zeb1 and Vimentin are shown in PC3 cells after transfection with 100 nM of miR-628 mimic or NC and imaged using film. (G) The effect of miR-628 on the expression of E-cadherin (ECAD) and N-cadherin (NCAD) was measured by RT/qPCR in LNCaP and PC3 cells after transfection with 100 nM of miR-628 mimic or NC (left panels). *p < 0.05, ***p < 0.001 (H) E-cadherin and N-cadherin protein expression was analyzed by Western blotting as described in the materials and methods section after transfection with 100 nM of miR-628 mimic or NC. Membranes were cut before hybridization using the molecular weight marker as a reference and imaged using an Azure imaging system. All western blot full images are provided in supplementary information files. (I) Angiogenesis was determined in HUVEC cells transfected with miR-628 or NC (upper panels). Representative images were captured using an inverted light microscope and representative images are shown at 20 × magnification. The tube length and number were determined at 24 h using ImageJ (lower panels; **p < 0.01, ***p < 0.001).

