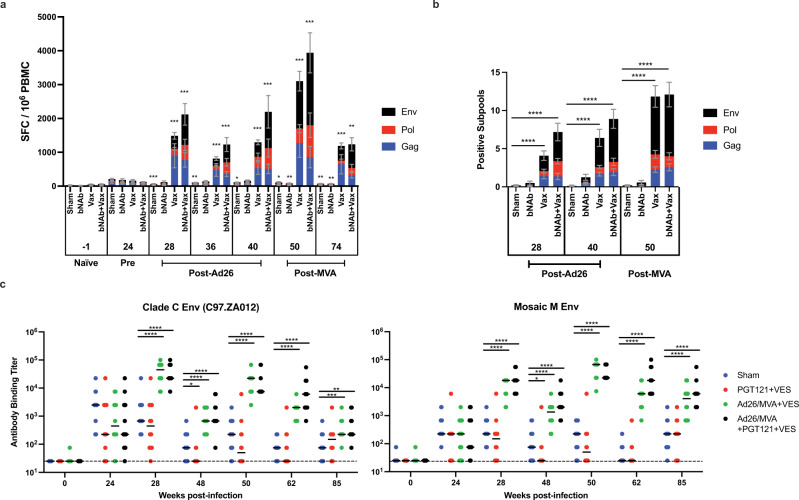
Fig. 2. Induction of immune responses to treatment interventions.
a Vaccination significantly and durably increased the size of SHIV-specific cellular immune IFN-γ responses over time in comparisons with pre-vaccination responses (“Pre”, week 24). Mean ± standard error is shown. b Vaccination significantly increased the breadth of SHIV-specific cellular immune IFN-γ responses in comparison to sham treatment. Means and standard errors are shown. c Vaccination significantly increased antibody binding to clade C and mosaic (mosaic 1) HIV-1 Env with median indicated. Two-sided Mann–Whitney tests were used to determine significance in non-paired analyses (a, c), and two-sided Wilcoxon matched-pairs sign rank tests were used in paired analyses (b). Sham = sham treatment; ‘bNAb’ or ‘PGT121 + VES’ = PGT121 + vesatolimod treatment; ‘Vax’ or ‘Ad26/MVA + VES’ = Ad26/MVA + vesatolimod treatment; and ‘bNAb + Vax’ or ‘Ad26/MVA + PGT121 + VES’ = Ad26/MVA, PGT121, + vesatolimod treatment. *p < 0.05 (in a, from left to right, p = 0.184 and 0.0339 for Sham; in c, p = 0.0465 in Clade C and 0.0489 in Mosaic M), **p < 0.01 (in a, from left to right, p = 0.0072 and 0.0016 for Sham, 0.0024 and 0.0068 for bNAb, and 0.002 for bNAb + Vax; in c, p = 0.0013), ***p < 0.001 (in a, from left to right, p = 0.005 for Sham, 0.0005 for all Vax, and 0.001 for bNAb + Vax from weeks 28 to 50; in c, p = 0.0008), ****p < 0.0001.

