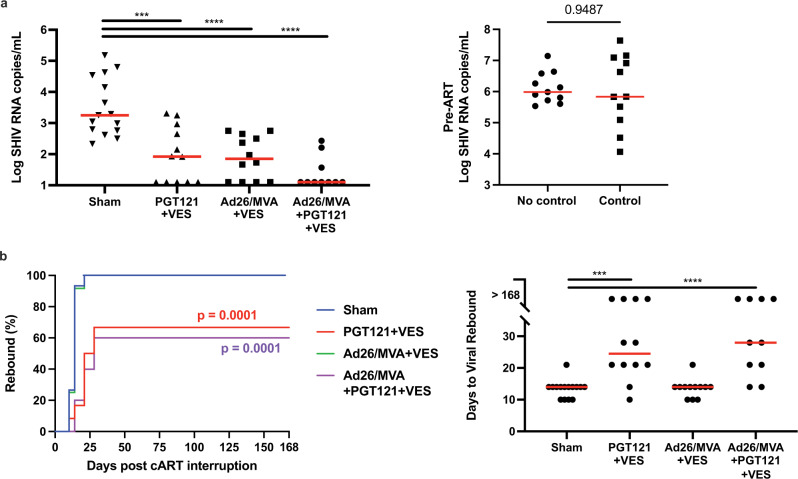
Fig. 4. All treatment interventions reduced post-treatment interruption viral loads.
a Treatment interventions induced significantly lower setpoint viral loads as compared to sham (left). There was no association of virologic control with pre-ART peak viral loads in the Ad26/MVA vaccinated animals (right). Two-sided Mann–Whitney tests used to determine significance. b PGT121 treatment significantly delayed viral rebound. The Kaplan–Meier plot shows the significant difference between the PGT121 groups and sham group, determined via the Mantel-Cox log-rank test (PGT121, χ2 = 14.37, p = 0.0001; Ad26/MVA + PGT121, χ2 = 14.85, p = 0.0001). The dot-plot visualizes the days to rebound (median indicated in red). Two-sided Mann–Whitney tests used to determine significance. Sham = sham treatment; PGT121 + VES = PGT121 + vesatolimod treatment; Ad26/MVA + VES = Ad26/MVA + vesatolimod treatment; and Ad26/MVA + PGT121 + VES = Ad26/MVA, PGT121, + vesatolimod treatment. Horizontal red lines indicate median values. ***p < 0.001 (in a, p = 0.0008; in b, p = 0.0002), ****p < 0.0001.

