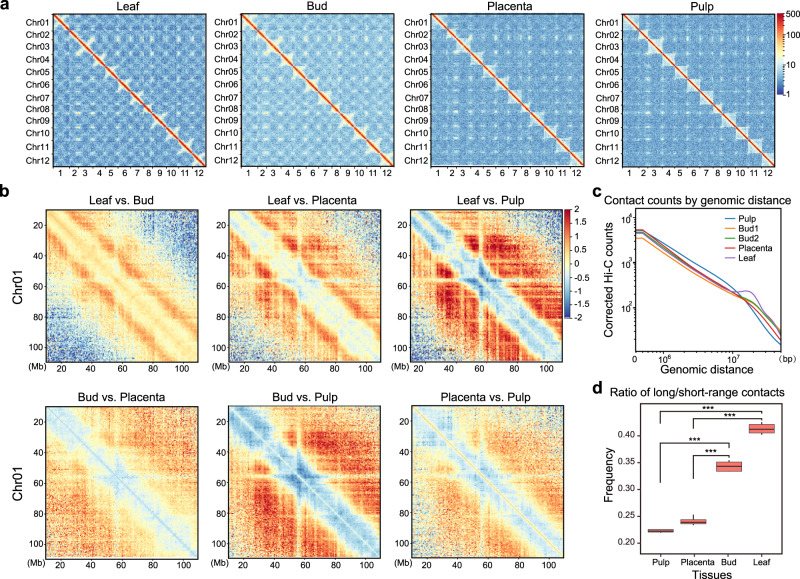
Fig. 1. Hi-C interaction matrices generated from four tissues of C. annuum.
a Genome-wide normalized and corrected Hi-C maps (HiCExplorer) at 500 kb resolution. In the leaf and bud, an X-shaped trans-interaction signal appears within each chromosome, while it is weaker or not evident in contact maps of pulp and placenta. See also Juicer Hi-C maps in Supplementary Fig. 7b. b The log2-transformed ratio of Hi-C matrices between tissues. Red designates enrichment in the first tissue and blue depletion. c The genomic distance vs. contact counts plot using Hi-C matrices at 500 kb resolution. Leaf and Bud show enrichment of long-range contacts (>20 Mb) than pulp and placenta. Only samples in the first batch were shown. See samples in the second batch in Supplementary Fig. 7c and results based on Juicer Hi-C maps in Supplementary Fig. 7d. d The ratio of long-range (>20 Mb) versus short-range contacts. The sample size for the boxplot is the number of chromosomes (n = 12). This ratio is significantly higher in leaf and bud compared to pulp and placenta. The boxplot represents the median (band inside the box), first and third quartiles. Whiskers extend to 1.5 times the interquartile range (IQR). P values (***p < 0.0005) were derived from two-side Wilcoxon matched-pairs signed-rank tests. For results from juicer Hi-C maps, see Supplementary Fig. 7e. Source Data underlying Fig. 1d is provided as a Source Data file.

