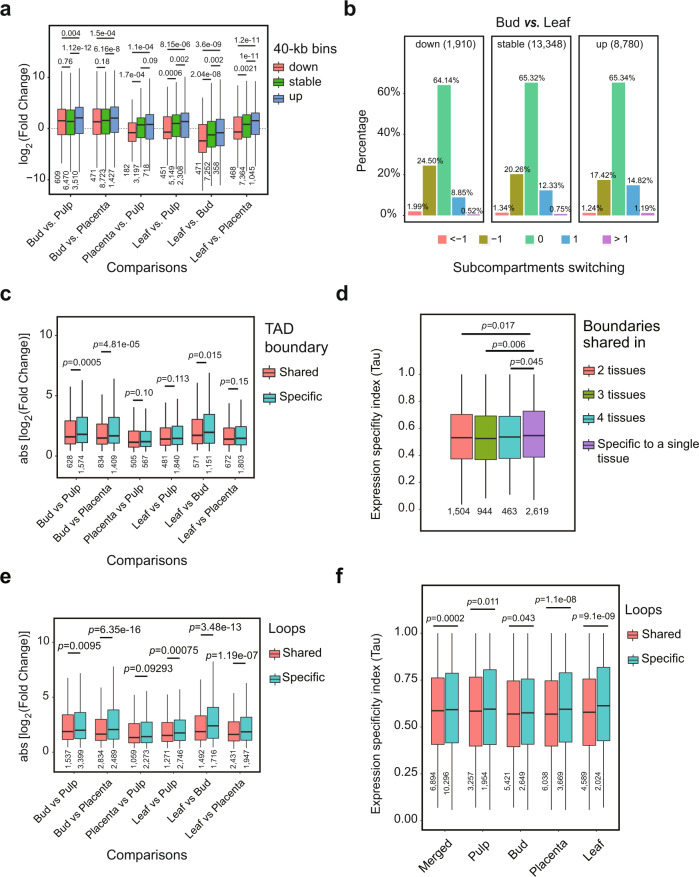
Fig. 7. Chromatin spatial features predict transcription variance.
a Genomic regions (i.e., 40-kb bins) switching from higher subcompartments to lower subcompartments (e.g., from A1.1 to A1.2) show a trend of decreasing expression between tissues, and conversely, switching from lower subcompartments to higher subcompartments show a trend of increasing expression. b Genomic regions with decreased expression were slightly enriched for cases of subcompartment switching from higher ranks to lower ranks, while those with increased expression were enriched for cases of subcompartment switching from lower ranks to higher ranks. Expression level decreases of more than twofold are labeled “down”, increases of more than twofold are labeled “up”, and changes within twofold are “stable”. Subcompartment switching from lower ranks to higher ranks are labeled “1” if spanning 1 rank or “>1” if more than 1 rank, from higher ranks to lower ranks are labeled “−1” if spanning 1 rank or “<−1” if more than 1 rank, and unchanged are labeled “0”. For more comparisons, see Supplementary Fig. 18. c Genomic regions overlapping with conserved TAD boundaries exhibit a relatively smaller absolute change fold in expression level between tissues than those overlapping with tissue-specific domain boundaries. Result depicted is for TopDom TAD annotation at 40 kb resolution, see results for other methods in Supplementary Fig. 19. d Genomic regions overlapping with shared TAD boundaries across tissues exhibit a significantly lower Tau value compared to those overlapped with tissue-specific boundaries. e Genomic regions overlapping anchors of shared loops between tissues have a relatively smaller change fold in expression level than those overlapping anchors of tissue-specific loops. f Genomic regions overlapping anchors of shared loops exhibit a significantly lower Tau value compared to those overlapping tissue-specific loops. Loops identified by hicDetectLoops were used in (e) and (f). Box plots in (a, c–f) represent the median (band inside the box), first and third quartiles. Whiskers extend to 1.5 times the IQR. Numbers below the bottom whiskers indicate the sample size. P values from one-side Wilcoxon signed-rank tests. Source Data underlying Fig. 7a, c–f are provided as a Source Data file.

