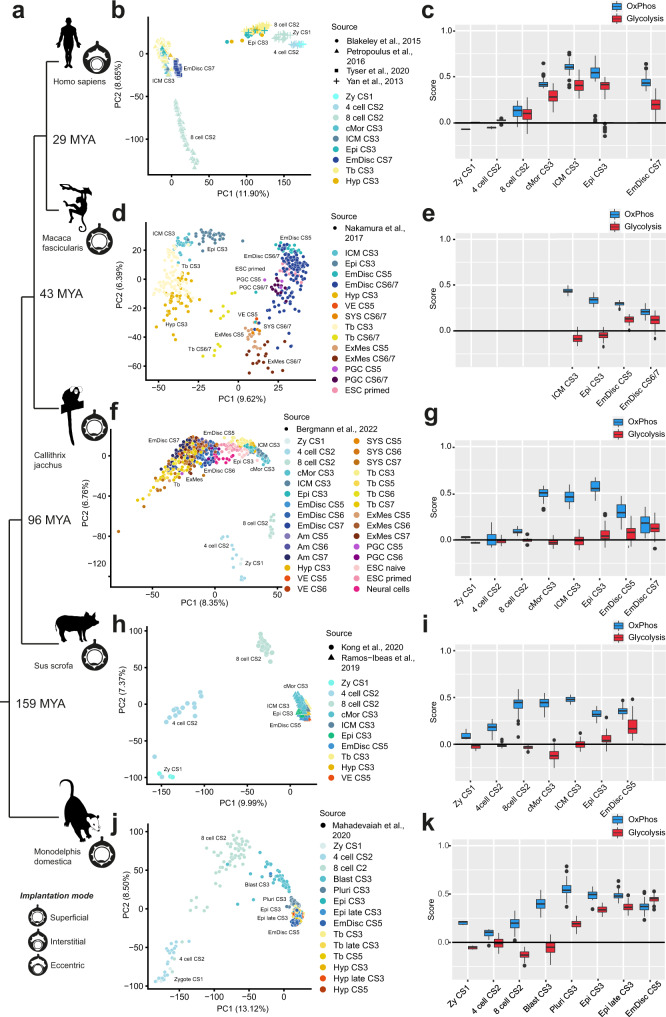
Fig. 2. The transcriptional metabolic programme in human, cynomolgus, marmoset, porcine and opossum embryonic development.
a A phylogenetic tree of five mammalian species analysed in this study. Distances are not to scale, timeline based on the Timetree tool85. Icons represent implantation modes in given species. MYA million years ago; values indicate time separating human from a given species. b PCA of samples from the human compiled dataset50–52. N numbers of individual groups are as follows: Zy CS1 = 3, 4 cell CS2 = 10, 8-cell CS2 = 94, cMor CS3 = 29, ICM CS3 = 66, Epi CS3 = 54, Epi CS7 = 147. d PCA of cynomolgus monkey samples55. N numbers of individual groups are as follows: ICM CS3 = 29, Epi CS3 = 68, EmDisc CS5 = 26, EmDisc CS6/7 = 129. f PCA of marmoset samples (Bergmann et al.56). N numbers of individual groups are as follows: Zy CS1 = 3, 4-cell CS2 = 12, 8-cell CS2 = 15, cMor CS3 = 53, ICM CS3 = 42, Epi CS3 = 38, EmDisc CS5 = 24, EmDisc CS6 = 46, EmDisc CS7 = 33. h PCA of porcine samples57,58. N numbers of individual groups are as follows: Zy CS1 = 3, 4-cell CS2 = 14, 8-cell CS2 = 26, cMor CS3 = 47, ICM CS3 = 24, Epi CS3 = 25, EmDisc CS5 = 48. (j) PCA of opossum samples59. N numbers of individual groups are as follows: Zy CS1 = 7, 4-cell CS2 = 21, 8-cell CS2 = 62, Blast CS3 = 55, Pluri CS3 = 140, Epi CS3 = 26, Epi late CS3 = 51, EmDisc CS5 = 106. c, e, g, i, k Boxplot graphs of scores for glycolysis and OxPhos modules in cell clusters representing embryonic tissues in datasets shown to the left of each graph. The boxplots are defined by the 25th and 75th percentiles, with the centre as the median. The minima and maxima extend to the largest value until 1.5 of the interquartile range (IQR) and the smallest value at most 1.5 of IQR, respectively. CS Carnegie stage, ZY zygote, 4-cell 4-cell stage, 8-cell 8-cell stage, cMor compacted morula, ICM inner cell mass, Epi epiblast, EmDisc embryonic disc, Tb trophoblast, Hyp hypoblast, VE visceral endoderm, AM amnioid, SYS secondary yolk sac, PGC primordial germ cells, ExM extraembryonic mesoderm, Blast blastocyst, Pluri pluriblast.

