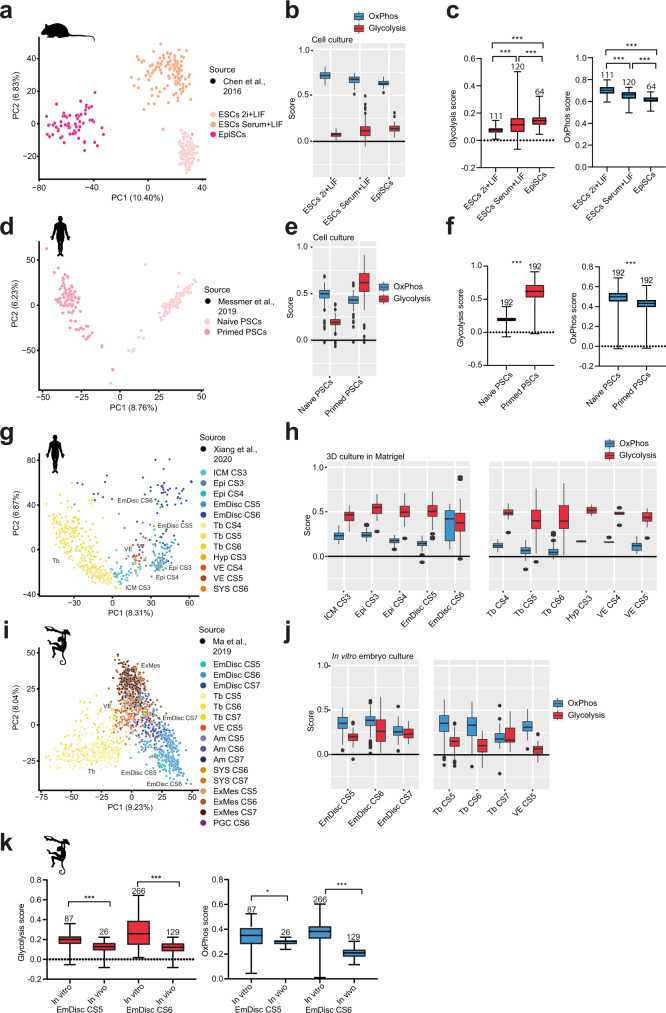
Fig. 4. OxPhos and glycolysis module score expression in human embryonic cell and primate embryo culture in vitro.
a PCA of mouse embryonic stem cells63. b Glycolysis and OxPhos module scores of samples shown in (a). c Comparisons of glycolysis and modules scores tested with Kruskal–Wallis test. P values for glycolysis scores are as follows: ESCs 2i+LIF vs ESCs Serum <0.001, ESCs 2i+LIF vs EpiSCs <0.001, ESCs Serum vs EpiSCs=0.001., for OxPhos scores all P values are <0.001. d PCA of human pluripotent stem cells66. e Module scores for samples in (d). f Comparisons of module scores tested using Mann–Whitney test. P values are as follows: for glycolysis <0.001, for OxPhos <0.001. g PCA of human embryo samples in 3D culture35. h Module scores of samples in (g). N numbers are as follows: ICM CS3 = 28, Epi CS3 = 27, Epi CS4 = 33, EmDisc CS5 = 59, EmDisc CS6 = 69, Tb CS4 = 27, Tb CS5 = 215, Tb CS6 = 65, Hyp CS3 = 2, VE CS4 = 6, VE CS5 = 17. i PCA of cynomolgus monkey post-implantation in vitro cultured embryo samples36. j Modules scores of samples in (i). N numbers, apart from the ones shown in (k) are as follows: EmDisc CS7 = 34, Tb CS5 = 294, Tb CS6 = 65, Tb CS7 = 21, VE CS5 = 45. k Comparisons of module scores between dataset in (i) and samples of stage-matched embryos developed in vivo55, tested by Kruskal–Wallis test. P values for glycolysis are <0.001, for OxPhos: In vitro EmDisc CS5 vs In vivo EmDisc CS5 = 0.491, In vitro EmDisc CS6 vs In vivo EmDisc CS6/7 < 0.001. ns nonsignificant, *P < 0.05, **P < 0.01, ***P < 0.001. The boxplots on the left are defined by the 25th and 75th percentiles, with the centre as the median. The minima and maxima extend to the largest value until 1.5 of the interquartile range (IQR) and the smallest value at most 1.5 of IQR, respectively. In the boxplots on the right the maxima and minima refer to the largest and smallest values, respectively. In all cases, Kruskal–Wallis tests were followed by Dunn’s multiple comparisons test and ANOVA’s were followed by Sidak’s multiple comparisons test. CS Carnegie stage, ZY zygote, 4-cell 4-cell stage, 8-cell 8-cell stage, cMor compacted morula, ICM inner cell mass, Epi epiblast, EmDisc embryonic disc, EpiSCs epiblast-like stem cells, PSCs pluripotent stem cells, ESCs embryonic stem cells, Tb trophoblast, Hyp hypoblast, VE visceral endoderm, AM amnioid, SYS secondary yolk sac, PGC primordial germ cells, ExM extraembryonic mesoderm.

