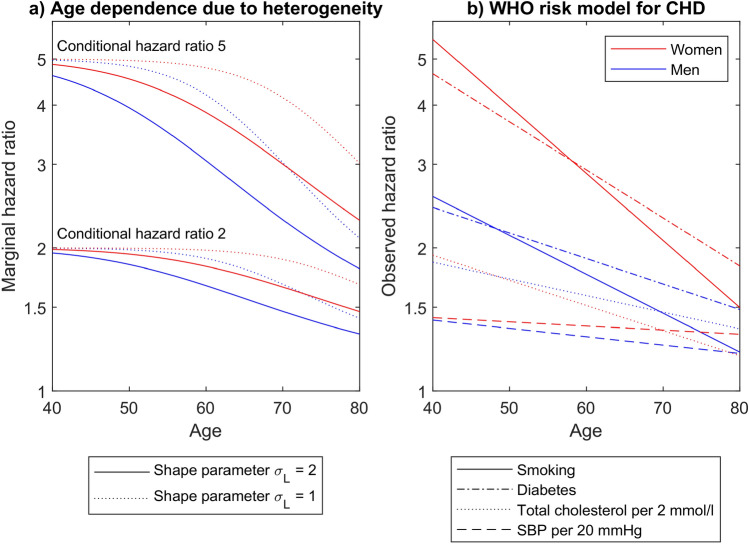
Figure 3.
Predicted and observed age dependence of hazard ratios. (a) Heterogeneity induced age dependence of the marginal hazard ratio for constant conditional hazard ratio values of 5 (lines originating at the top left) and 2 (other lines). Two different values of the shape parameter were applied for unobserved heterogeneity. Exponentially increasing conditional hazards were assumed as shown in Fig. 2 for Germany. (b) Age dependence of the hazard ratios of several risk factors for 10-year cardiovascular risk, as derived by the WHO CVD Risk Chart Working Group38. In both panels, red lines refer to women, blue lines to men.

