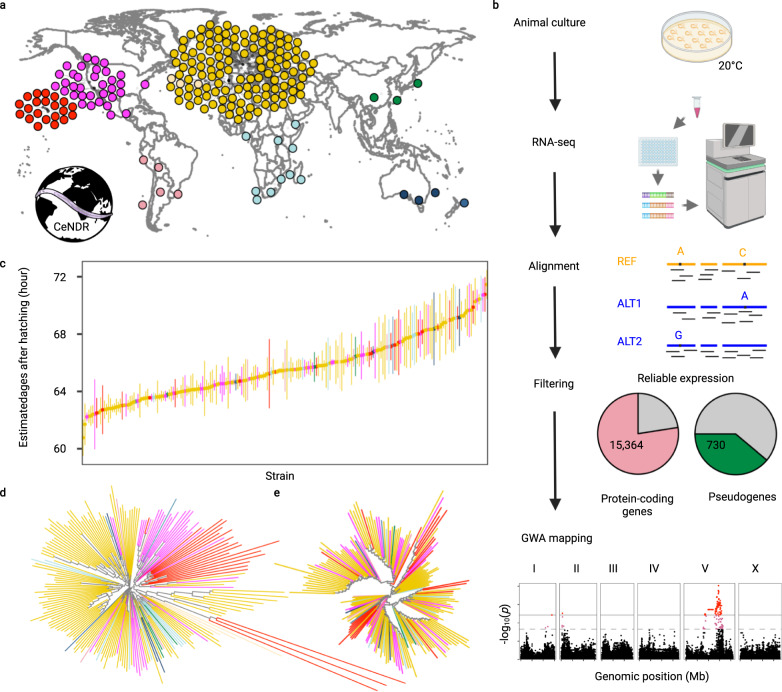
Fig. 1. Overview of species-wide expression analysis in wild C. elegans.
a Global distribution of 205 of the 207 wild C. elegans strains that were obtained from CeNDR and used in this study. Strains are colored by their sampling location continent (yellow, Europe; magenta, North America; pink, South America; light blue, Africa; dark blue, Australia; green, Asia), except for Hawaiian strains (red). The two strains missing on the map are lacking sampling locations. b Graphic illustration of the workflow to acquire C. elegans transcriptome data. Created using BioRender.com. c Estimated developmental age (y-axis) of 207 wild C. elegans strains (x-axis), of which 147 strains had three replicates and 60 strains had two replicates. Strains on the x-axis are sorted by their mean estimated age from two to three biological replicates. Error bars show the standard deviation of estimated age among replicates of each strain. d, e Two neighbor-joining trees of the 207 C. elegans strains using 598,408 biallelic segregating sites in non-divergent regions (d) and expression of 22,268 transcripts in non-divergent regions (e) are shown. Strains in c–e are colored as in a.

