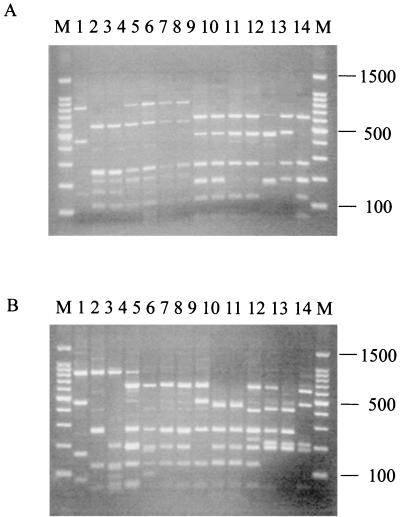
FIG. 2.
PCR-RFLP profiles of a selection of human butyrate-producing isolates and standard strains digested with the restriction endonuclease AluI. (A) Lanes 1 to 14 contain human colonic isolates A2-165 (ribotype 7), A2-168 (ribotype 11), A2-166 (ribotype 11), A2-228 (ribotype 14), A2-175 (ribotype 14), A2-178 (ribotype 14), T2-132 (ribotype 14), A1-89 (ribotype 4), A2-171 (ribotype 4), A2-181 (ribotype 4), A2-183 (ribotype 4), T2-87 (ribotype 17), T2-145 (ribotype 18), and T1-815 (ribotype 5), respectively. (B) Lanes 1 to 12 contain human colonic isolates L2-6 (ribotype 7), L2-12 (ribotype 10), L2-10 (ribotype 9), L2-21 (ribotype 3b), L1-92 (ribotype 3a), L2-9 (ribotype 3b), L2-16 (ribotype 3b), L1-81 (ribotype 1), L2-7 (ribotype 8), L2-65 (ribotype 8), L1-83 (ribotype 2), and B. fibrisolvens 16.4, respectively. Lanes 13 and 14 contain rumen isolates B. fibrisolvens 1.230 and B. fibrisolvens 2221 (ATCC 19971), respectively. Size markers (1-kb ladder; Promega) are shown in lanes marked “M.” The 610-bp band in panel A, lanes 4 to 7, and in panel B, lanes 4, 7, and 8 and the 400-bp fragment in panel B, lane 11, represent partial products. Ribotype groups 6, 12, 13, 15, and 16 are not represented in this figure. Their AluI banding profiles (in base pairs) are 610, 475, 210, 190, and 50 (ribotype 6); 610, 240, and 220 (ribotype 12); 475, 265, 220, and 190 (ribotype 13); 400, 265, 220, 190, and 127 (ribotype 15); and 797, 610, 265, and 190 (ribotype 16). The band pattern for ribotype 6 is similar to that in panel A, lanes 8 to 11, while that for ribotype 12 is similar to that in panel A, lanes 4 to 7. The band pattern for ribotype 13 is similar to that in panel A, lane 12, while that for ribotype 15 is similar to that in panel B, lane 13. The band pattern for ribotype 16 is similar to that in panel A, lanes 4 to 7.

