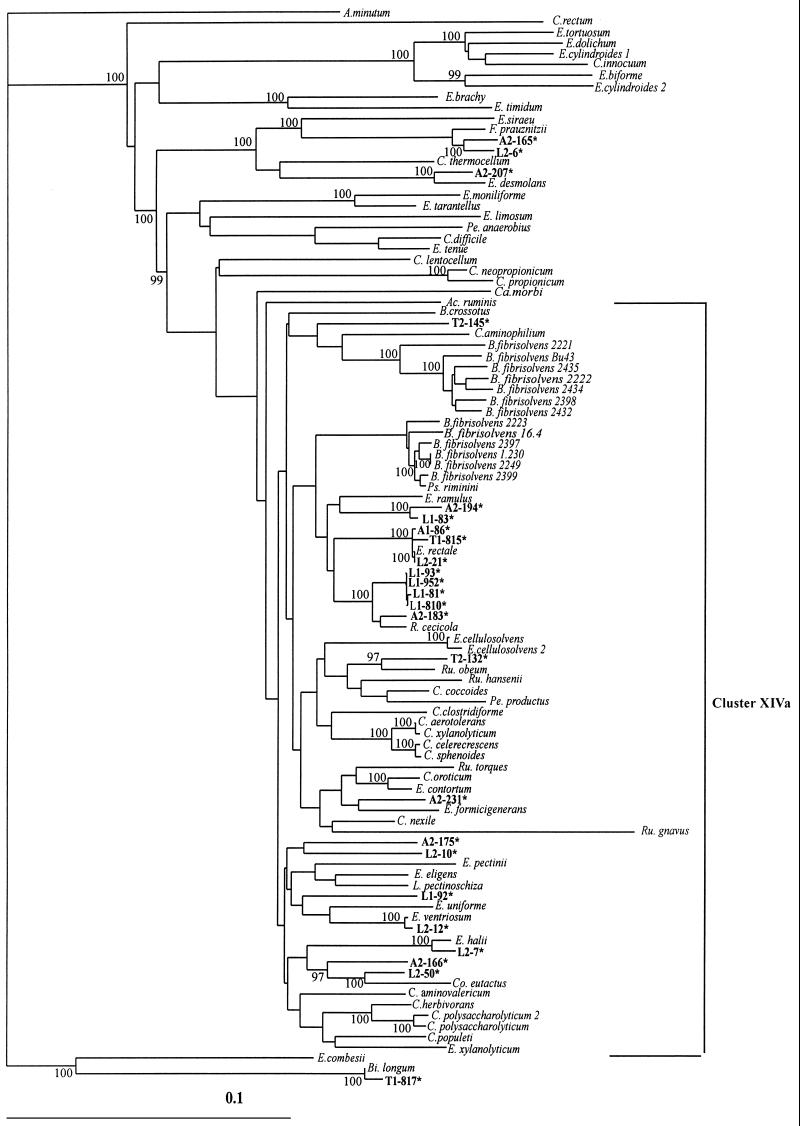
FIG. 3.
Phylogenetic tree showing the relationships of 16S rDNA sequences from human butyrate-producing isolates falling within cluster XIVa of the Clostridium subphylum of low-G+C-content gram-positive bacteria (7, 48). The scale bar represents genetic distance (10 substitutions per 100 nucleotides). The tree was constructed using the neighbor-joining analysis of a distance matrix obtained from a multiple-sequence alignment. Bootstrap values (expressed as percentages of the value for 100 replications) are shown at branch points; values of 97% or more were considered significant. Sequences derived from the database are shown in italics (e.g., B. fibrisolvens). Atopobium minutum is used as the outgroup sequence.

