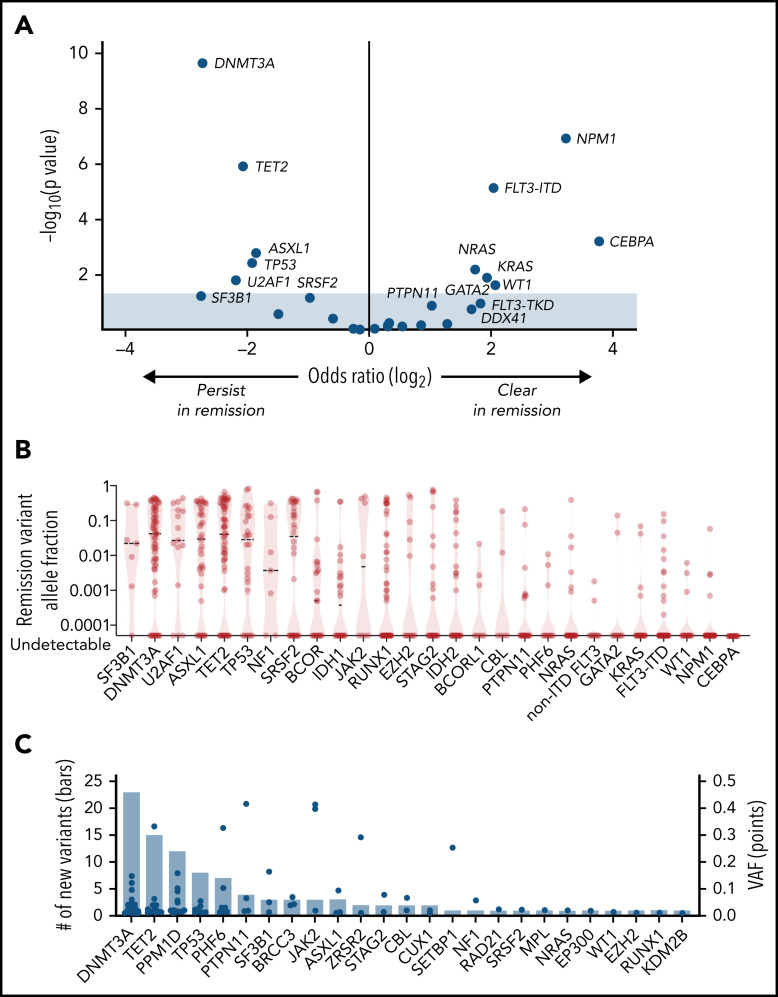
Figure 3.
Characteristics of remission mutations. (A) Results of Fisher’s exact test for clearance or persistence of each gene, plotting the odds of clearance on the x-axis and significance, expressed as the negative log of the uncorrected P value, on the y-axis. Shown are mutations that are more likely to persist at remission (left) and those that are more likely to clear (right). (B) VAF of remission mutations. Median VAF is denoted by the dashed lines, and the range is indicated by the red violin plot for each gene. A version of this figure that excludes the 26 mutations with VAF < 0.001 is in supplemental Figure 3. (C) The number (left y-axis) and VAF (right y-axis) of mutations present at remission that were not detected at diagnosis, in descending order of frequency. VAFs are represented by blue dots and the total number of mutations is represented by the bars.

