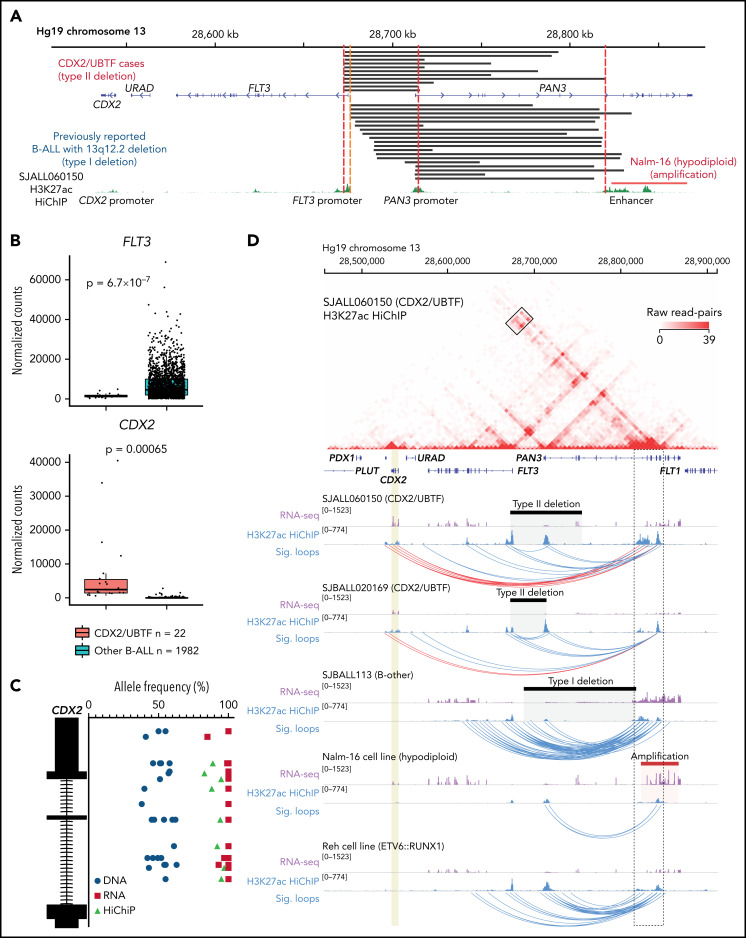
Figure 3.
Enhancer retargeting of FLT3-PAN3 regions drives deregulation of CDX2 in CDX2/UBTF subtype. (A) The deleted FLT3/PAN3 regions detected by WGS (type II deletion; top) and previously reported49 deleted 13q12.2 regions (type I deletion; bottom) are shown in black bars. Amplification of 13q12.2 found in Nalm-16 (hypodiploid B-ALL) is shown in a red bar. Type II deletion includes the promoter of FLT3 but not in type I deletion. Type II deletion does not affect the enhancer in PAN3. (B) Expression of FLT3 and CDX2 genes by normalized read counts comparing CDX2/UBTF and other B-ALL cases are shown. CDX2/UBTF B-ALL cases exhibited lower FLT3 expression and higher CDX2 expression. (C) Allele-specific expression of CDX2 is confirmed by comparison of allele frequencies at bases of heterozygous single-nucleotide polymorphism among RNA-seq (red), WGS (blue), and HiChIP (green). (D) H3K27ac HiChIP data are shown for representative patient samples (n = 3, SJALL060150 and SJBALL020169 [CDX2/UBTF B-ALL with type II deletion] and SJBALL113 [B-other with type I deletion]) and cell lines (n = 2, Nalm-16 [hypodiploid with PAN3 genic enhancer amplification] and Reh [ETV6::RUNX1 with no type I or type II deletion]). The heatmap shows raw read counts for all pairwise 5 kb genomic bins in the viewing window (chr13:28,457,037-28,911,626) for sample SJALL060150. The black box outlines read-pairs mapping to the CDX2 gene (highlighted in gold) and PAN3 genic enhancers (black dotted outline). Below the heatmap are RNA-seq and 1-dimensional HiChIP coverage tracks for all 5 samples. The corresponding heatmap for each sample can be found in supplemental Figure 8. Black bars indicate sample-specific deletions, whereas the Nalm-16 amplification is shown in red. Significant (false discovery rate < 0.01) loops called with MAPS42 are shown as blue arcs. Significant loops linking the PAN3 genic enhancers to CDX2 are shown in red.

