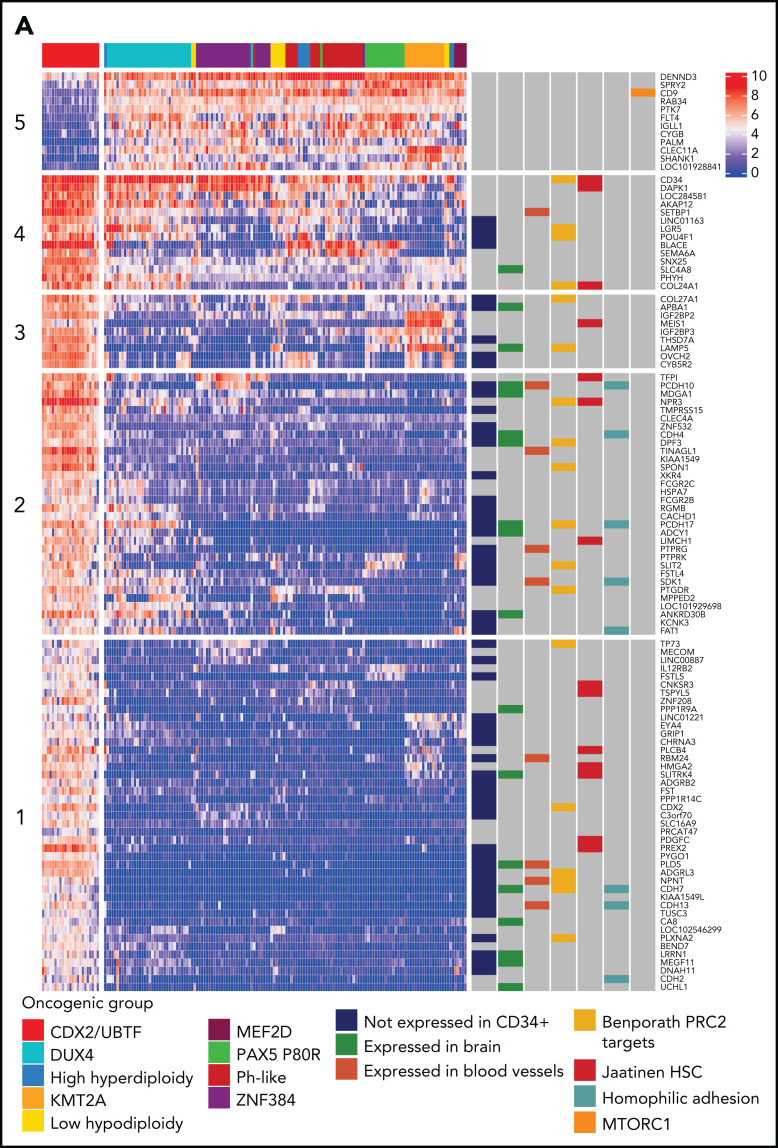
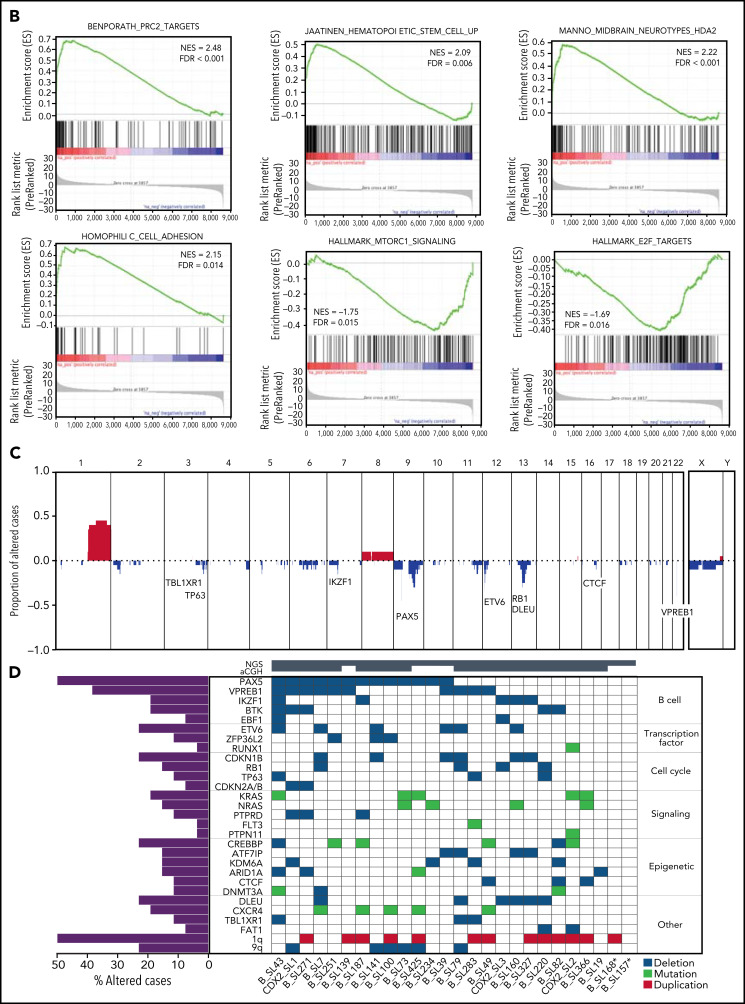
Figure 5.
Transcriptional signature and genomic landscape of CDX2/UBTF ALL. (A) Heatmap representing biclustering of gene expression from the major subtypes in the RNA-seq cohort (excluding unclassified cases). Genes were selected after comparison between expression means (fold change >3, P < 10−7) resulting in a list of 110 genes (supplemental Table 7). Annotations on the right are derived from selected gene set enrichment analyses (GSEA) shown in (B) and expression data from The Human Cell Atlas Bone Marrow Single-Cell Interactive Web Portal (http://www.altanalyze.org/ICGS/HCA/splash.php) and the TSEA atlas (genetics.wustl.edu/jdlab/tsea/) (B) Selected GSEA for genes expressed in CDX2/UBTF ALL as compared with other cases, showing significant enrichment in genes regulated by the Polycomb repressive complex 2 (PRC2), genes expressed in cord blood–derived CD133+ cells enriched in hematopoietic stem cells, genes involved in homophilic cell-cell adhesion, and genes expressed in a subset of embryonic neurons. The differential gene list is negatively enriched in genes upregulated through mTORC1 signaling and E2F target genes. GSEA core genes are listed in supplemental Table 11. (C) Copy-number alterations in CDX2/UBTF ALL as determined by array-CGH analysis (n = 20). (D) Heatmap of recurrent alterations in CDX2/UBTF cases as determined by array-CGH and targeted sequencing (n = 26), with frequencies of altered cases indicated on the left. *Cases with low blast infiltration (ie, <30%), with possibly focal copy-number alterations overlooked. TSEA, tissue specific expression analysis.


