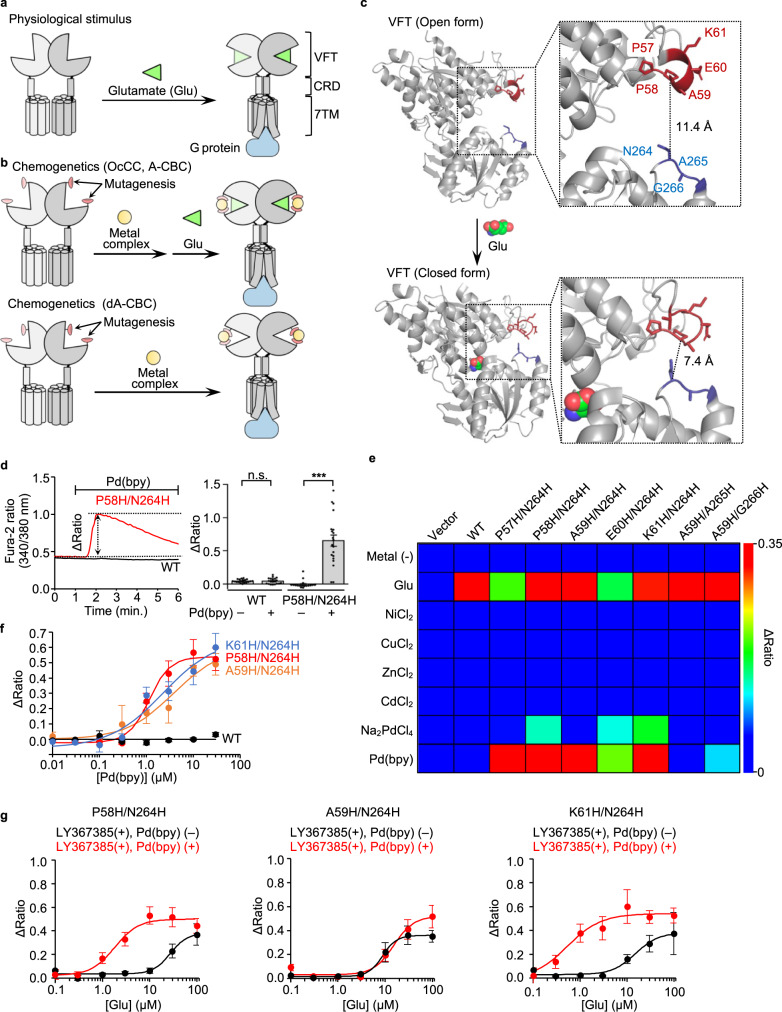
Fig. 1. Screening of the direct-activation-type mGlu1 mutants.
a Schematic illustration of glutamate-induced conformational changes of mGlu1. b Schematic illustration of the coordination-based chemogenetics (CBC). Upper: allosteric activation of mGlu1 by A-CBC (OcCC in our previous terminology). Bottom: direct activation of mGlu1 by dA-CBC. c Conformational change of the VFT on the glutamate binding. Upper: open form in the apo state (Protein Data Bank (PDB) 1EWT). Lower: closed form in the glutamate-binding state (PDB 1EWK). The mutation sites at the upper and lower lobes are highlighted in red and blue. d Pd(bpy)-induced mGlu1 responses in HEK293 cells. Left: representative trace of Ca2+ response induced by 10 µM of Pd(bpy) in HEK293 cells transfected with the plasmid of mGlu1 P58H/N264H mutant (red) or WT mGlu1 (black). The Δratio is defined as the difference between the maximum and the initial ratio values. Right: averaged Δratio in the presence or absence of 10 µM of Pd(bpy) for WT (P = 0.9423) and P58H/N264H (P = 2.214 × 10⁻⁷). (n = 20). (Two-tailed Welch’s t-test, ***P < 0.001, n.s. not significant). e The heatmap shows the averaged Δratio induced by 10 µM glutamate, metal ions, or a metal complex. See Supplementary Fig. 1b for each data. f Concentration-dependent curves for Pd(bpy) in HEK293 cells expressing mGlu1 WT (black), P58H/N264H (red), A59H/N264H (orange), or K61H/N264H (blue). (n = 20). EC50 values were 1.2, 3.8, and 2.3 µM for P58H/N264H, A59H/N264H, and K61H/N264H, respectively. g Evaluation of the positive allosteric effect of Pd(bpy) to the mGlu1 mutants. Effects of 3 µM Pd(bpy) on the concentration-dependency of the glutamate-responses were examined in the presence of 10 µM LY367385 in HEK293 cells expressing the hit mutants (P58H/N264H, A59H/N264H, K61H/N264H). (n = 20). Data are presented as mean ± s.e.m. See Supplementary Figure 3g, h for the representative traces.

