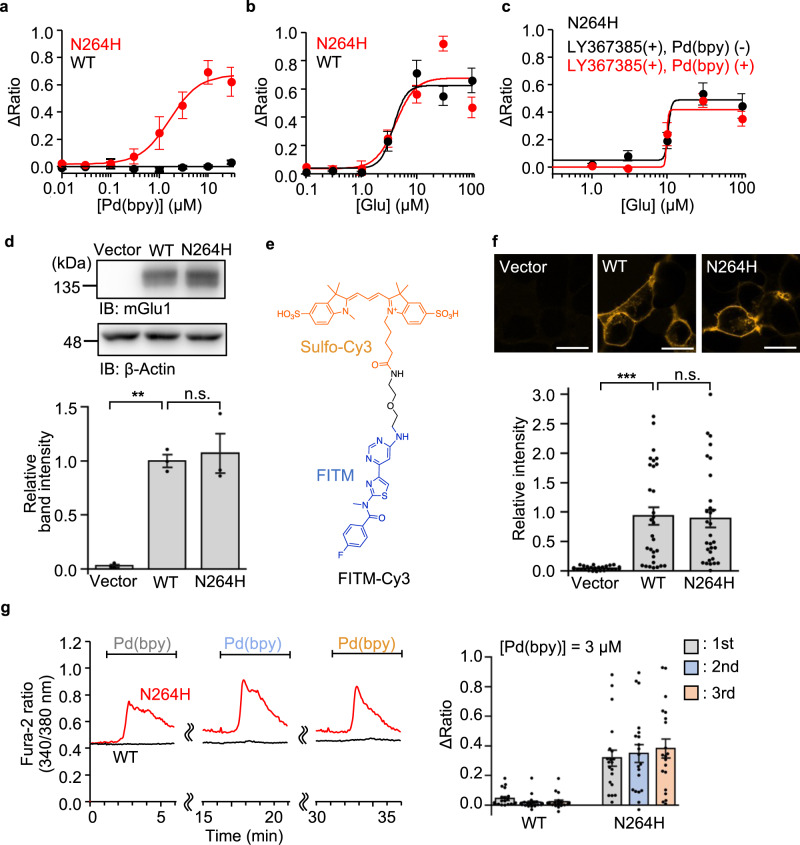
Fig. 3. Characterization of mGlu1(N264H) mutant.
a, b Concentration-dependent curves for Pd(bpy) (a) and glutamate (b) in HEK293 cells expressing mGlu1(N264H) or WT mGlu1. (n = 20). c Evaluation of the positive allosteric effect of Pd(bpy) to the mGlu1(N264H) mutant. Effect of 3 µM Pd(bpy) on the concentration-dependency of the glutamate-responses in the presence of 10 µM LY367385 in HEK293 cells expressing mGlu1(N264H) is shown. (n = 20). d Evaluation of the protein expression level of mGlu1(N264H) by western blotting. (n = 3, biologically independent experiments, P = 0.0015, 0.8708 for WT, N264H, respectively). (One-way ANOVA with Dunnet’s test, **P < 0.01, n.s. not significant). Full scan images are shown in Source Data. e Chemical structure of FITM-Cy3, a fluorescent probe for mGlu1. f Evaluation of the cell-surface expression of mGlu1(N264H) by live imaging using FITM-Cy3. Upper: Representative confocal images of the HEK293 cells transfected with WT mGlu1, mGlu1(N264H), or vector control after addition of 1 µM FITM-Cy3. Lower: quantification of fluorescent intensity on the cell surface. (n = 30, P = 0.0008, 0.9936 for WT, N264H, respectively). Scale bars, 20 μm. (One-way ANOVA with Dunnet’s test, ***P < 0.001, n.s. not significant). g The Ca2+ response induced by the repetitive treatment of 3 µM Pd(bpy). Left: representative trace of the Ca2+ response induced by 3 µM Pd(bpy) in HEK293 cells expressing WT mGlu1 (black) or mGlu1(N264H) (red). Pd(bpy) was treated repetitively after washing the cells with the culture medium and measurement buffer for 10 min. Right: averaged Δratio induced by 3 µM Pd(bpy). (n = 20). Data are presented as mean ± s.e.m.

