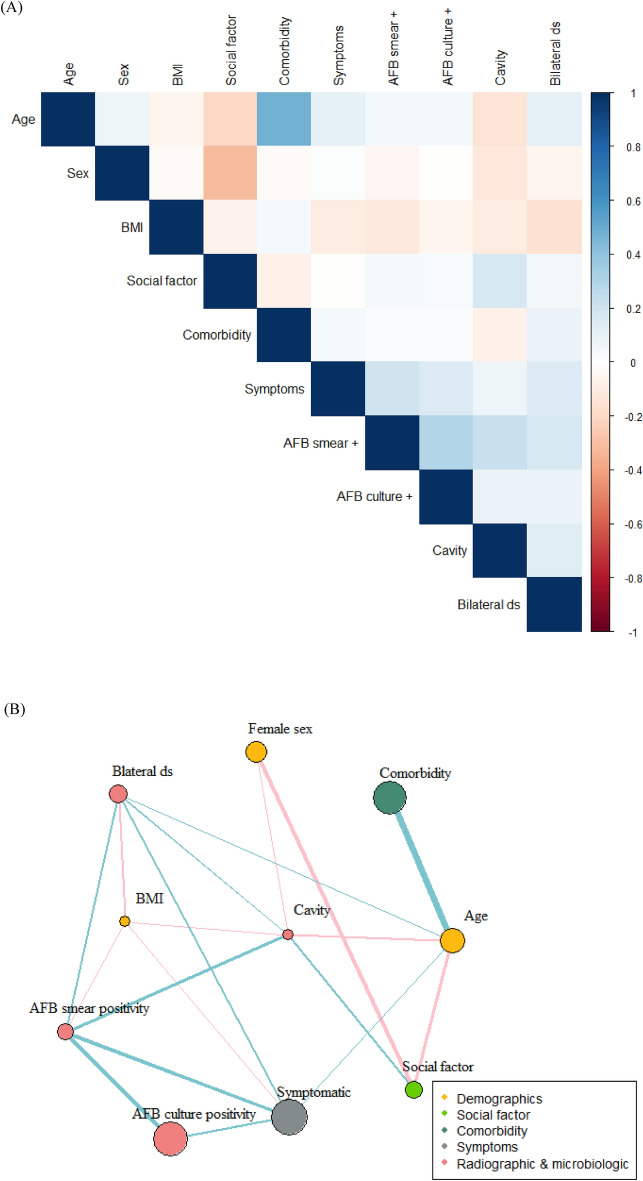
Figure 1.
Correlation matrix (A) and correlation network (B) of variables. (A) Pearson correlation between variables was performed. Intensity of colour correlates with strength of their association. Colour of blue indicates positive correlation and that of red for negative correlation. (B) Links or edges between nodes indicate the existence of a statistically significant associations (P < 0.05). The thickness of edges correlated with the strength of their association (Pearson’s R coefficient): colour of blue for positive and that of pink for negative correlation. Social factor was defined as being at least one of smoker, drinker, and Medicaid subscriber. BMI, body mass index; AFB, acid-fast bacilli.

