Figure 2.
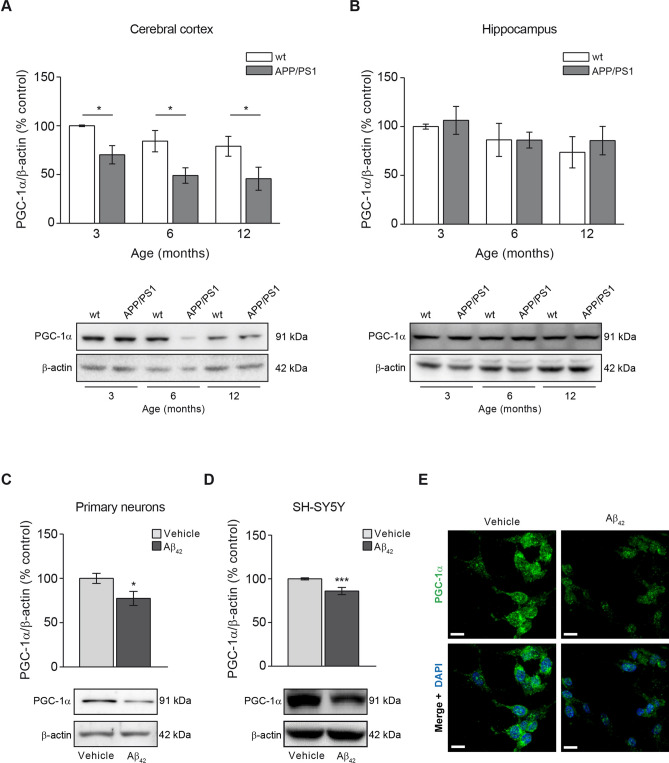
The mitochondrial biogenesis indicator PGC-1α is reduced due to Aβ overload. Mitochondrial biogenesis was studied by analysing the levels of the mitochondrial biogenesis master regulator, the transcription factor PGC-1α. The levels of PGC-1α in cerebral cortex (A) and hippocampus (B) from 3-, 6- and 12-month-old wt and APP/PS1 mice are shown. Upper panels show histograms representing the protein densitometric analysis and the bottom panels present representative experiments. Data are expressed as mean ± SEM; n = 5–10 mice. *p < 0.05. Statistical significance was assessed by two-way ANOVA followed by Tukey’s post hoc test for multiple comparisons. Histograms showing the PGC-1α levels in rat primary neurons (C) and SH-SY5Y cells (D) treated with 1 µM oligomerised Aβ42 for 24 h. Representative images of immunoblots are presented at the bottom panels. Data are expressed as mean ± SEM; primary neurons: n = 7, SH-SY5Y cells: n = 6. *p < 0.05; ***p < 0.001. Statistical significance was assessed by student’s t-test. (E) Immunofluorescence showing PGC-1α of SH-SY5Y cells treated with and without 1 µM oligomerised Aβ42 for 24 h. Cytoplasmic distribution of PGC-1α in cells is shown in green and the nuclei stained with DAPI are shown in blue. Scale bar = 14 µm.

