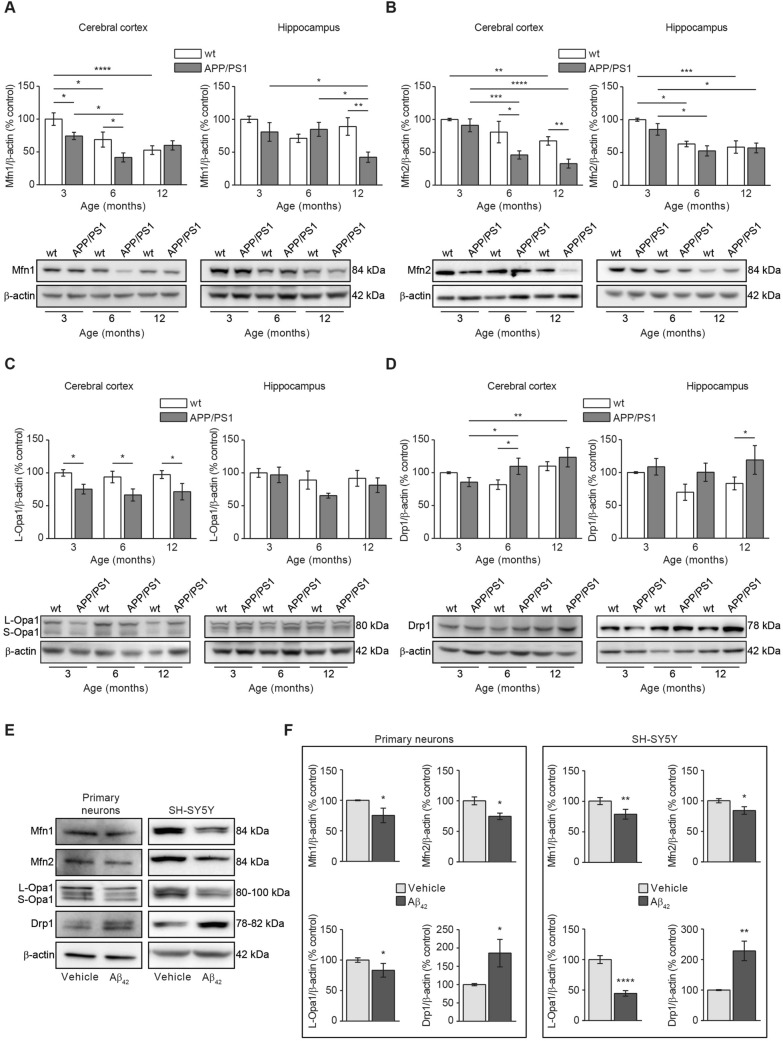
Figure 3.
Aβ overload induces alterations in the mitochondrial dynamics towards increasing fission and reducing fusion balance. Mitochondrial dynamics was evaluated by analysing the levels of representative mitochondrial Mfn1 (A), Mfn2 (B) and Opa1 (C) fusion and Drp1 (C) fission proteins. In all cases (A–D) Histograms represent the densitometric protein levels in cerebral cortex (left panels) and hippocampus (right panel) from 3-, 6- and 12-month-old wt and APP/PS1 mice. Bottom panels show representative immunoblots. Data are expressed as mean ± SEM; n = 5–10 mice. *p < 0.05; **p < 0.01; ***p < 0.001; ****p < 0.0001. Statistical significance was assessed by two-way ANOVA followed by Tukey’s post hoc test for multiple comparisons. (E) Representative immunoblots showing the mitochondrial fusion (Mfn1, Mfn2 and Opa1) and fission (Drp1) proteins in rat primary neuronal cell cultures and SH-SY5Y cells after 24 h treatment with 1 µM oligomerised Aβ42. (F) Histograms presenting the densitometric analysis of the mitochondrial fusion (Mfn1, Mfn2 and Opa1) and fission (Drp1) proteins in rat primary neuronal cell cultures (left panel) and SH-SY5Y cells (right panel) after 24 h treatment with or without 1 µM oligomerised Aβ42. Data are expressed as mean ± SEM; primary neurons: n = 7, SH-SY5Y cells: n = 6. *p < 0.05; **p < 0.01; ****p < 0.0001. Statistical significance was assessed by student’s t-test.

