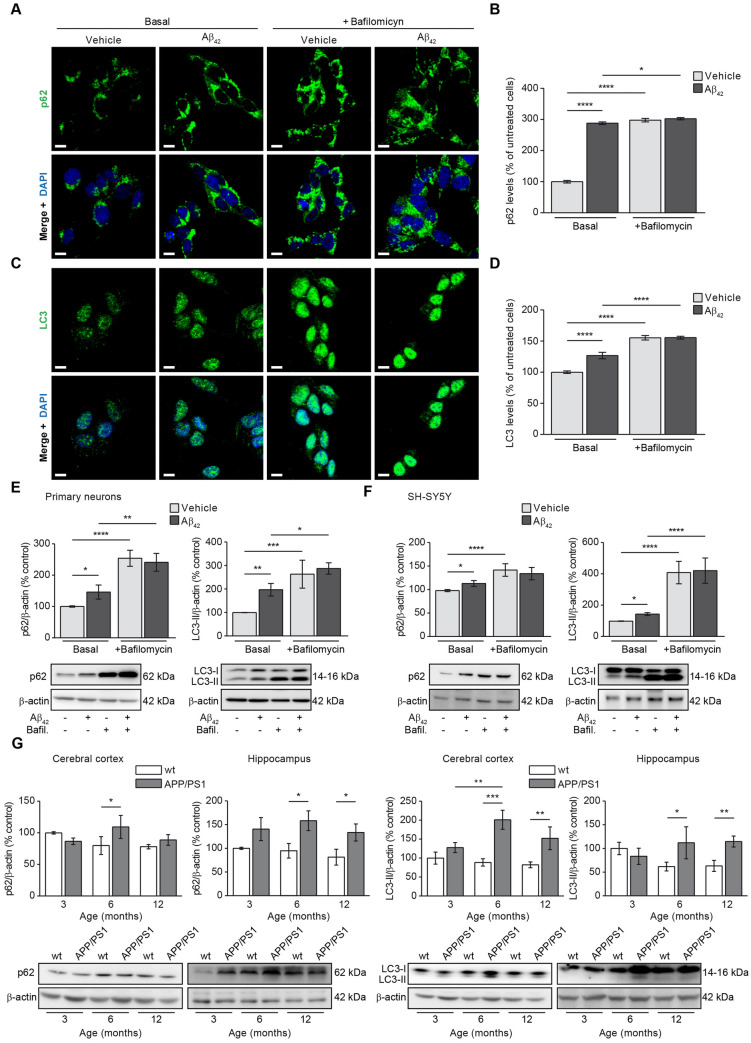
Figure 5.
Autophagy is increased upon Aβ overload. The effect of Aβ on autophagy was evaluated in SH-SY5Y cells by analysing the levels of the main autophagy markers p62 (A and B) and LC3 (C and D) by immunofluorescence. Representative images of SH-SY5Y cells treated with or without 1 µM oligomerised Aβ42 for 24 h (Basal) showing the autophagy marker p62 (A) and punctate-like structures of LC3-II (C) in green. The autophagosome accumulation was evaluated by addition of the autophagosome—lysosome fusion inhibitor bafilomycin (100 nM). In all cases the nuclei were stained with DAPI (blue). Scale bar = 9 µm. Histograms show the levels of p62 (B) and LC3-II (D) that were estimated analysing the fluorescence in the basal stage and in the presence of bafilomycin (100 nM) with or without 1 µM oligomerised Aβ42 for 24 h. (E and F). Data are expressed as mean ± SEM; n = 5. Statistical significance was assessed by one-way ANOVA followed by Fisher’s post hoc test for multiple comparisons. *p < 0.05; ****p < 0.0001. Autophagy levels were verified analysing the p62 and LC3-II levels by immunoblotting in rat primary neuronal cell culture (E) and SH-SY5Y cells (F) with or without 1 µM oligomerised Aβ42 for 24 h in absence (Basal) or presence of bafilomycin (100 nM). In all cases top panels show the histograms indicating the protein levels estimation for each marker and the bottom panels show representative western blots. Data are expressed as mean ± SEM; primary neurons: n = 4, SH-SY5Y cells: n = 7. Statistical significance was assessed by one-way ANOVA followed by Fisher’s post hoc test for multiple comparisons. *p < 0.05; **p < 0.01; ***p < 0.001; ****p < 0.0001. (G) Autophagy was evaluated in mice by analysing the levels of representative autophagy markers p62 (panel first and second from left to right) and LC3-II (panel third and forth from left to right). In all cases, histograms represent the densitometric protein levels in cerebral cortex (panel first and third from left to right) and hippocampus (panel second and fourth from left to right) from 3-, 6- and 12-month-old wt and APP/PS1 mice. Bottom panels show representative immunoblots. Data are expressed as mean ± SEM; n = 5–10 mice. *p < 0.05; **p < 0.01; ***p < 0.001. Statistical significance was assessed by two-way ANOVA followed by Tukey’s post hoc test for multiple comparisons.

