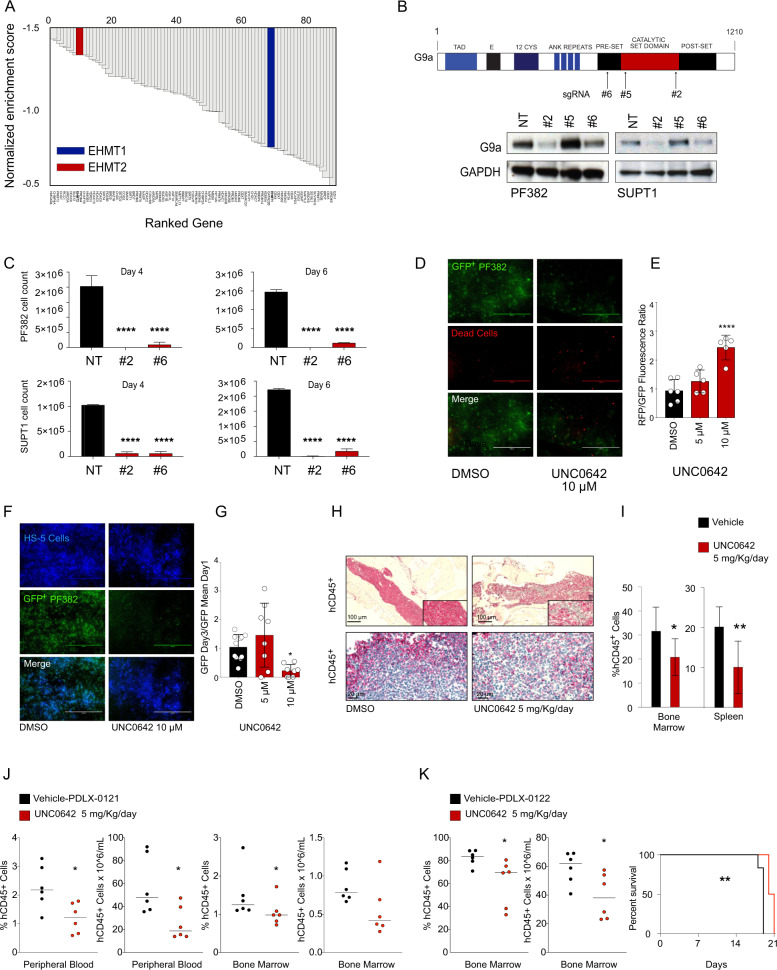
Fig. 2. G9a enzymatic abrogation impairs T-ALL proliferation in vitro, 3D and in vivo preclinical T-ALL models.
A shRNA screen identified that EHMT2 is required for T-ALL cell survival. Top hits are ranked with a negative Normalized Enrichment Score (NES). shRNA screen was performed in DND41 T-ALL cell line [19]. B Schematic representation of the G9a protein with the indicated functional domains (top). On the bottom, western blot showing expression of G9a in PF382 and SUPT1 cells 2 days post sgRNA selection. Protein lysates were stained with an anti-G9a antibody. GAPDH was used as loading control. NT = non-targeting. C Effect of G9a loss in PF382 and SUPT1 cells at four or six days post sgRNA selection. Histograms show cell count using the trypan blue exclusion assay. Error bar denotes the mean ± SD of a minimum of three biological replicates. Statistical significance among groups (****P ≤ 0.0001) was determined by a non-parametric t-test (Mann–Whitney). NT = non-targeting, #2 = sgRNA #2 directed against EHMT2. D Live Dead assay of GFP + PF382 in 3D cell culture treated with DMSO or UNC0642 at the indicated concentrations. Representative immunofluorescence images of control or UNC0642 treated PF382 cells upon Live/Dead® staining at 72 h. Scale bars: 1000 μm. E Cell viability assay of GFP + PF382 cell in 3D culture treated with DMSO or UNC0642 at the indicated concentrations. Cell death is indicated in the histogram as a fluorescence ratio between GFP + (viable cells) and RFP + (dead cells) signals of the acquired fields. Error bars denote the mean ± standard deviation (SD) of one representative experiment. Statistical significance among groups for treated vs. vehicle (DMSO) (****P ≤ 0.0001) was determined by one-way ANOVA using Bonferroni’s correction for multiple comparison testing. F Preclinical validation of UNC0642 in PF382 co-cultured with HS-5 human stromal cells in 3D scaffolds. Representative immunofluorescence images of control or UNC0642 treated PF382 (green) cultured in 3D scaffolds with stromal HS-5 cells (blue) at Day 3. Scale bars: 1000 μm. G Preclinical validation of UNC0642 in PF382 co-cultured with HS-5 human stromal cells in 3D scaffolds. The histogram shows the effect of UNC0642 treatment on PF382 cell viability as represented by a GFP fold increase relative to day 1. Error bars denote the mean ± standard deviation (SD) of one representative experiment. Statistical significance among groups for treated vs. vehicle (DMSO) (*P ≤ 0.05) was determined by one-way ANOVA using Bonferroni’s correction for multiple comparison testing. H Antileukemic activity of UNC0642 in hCD45+ bone marrow infiltrating cells (top panels) and spleen (bottom panel) in a MOLT16 xenografted murine model after 12 days of UNC0642 treatment (5 mg/kg/IP every 48 h) or vehicle (corn oil). Formalin-fixed, paraffin embedded tissue sections were stained with anti hCD45 antibody. Scale bars, 100 or 20 μm. I The number of hCD45+ cells per field was represented as percentage relative to vehicle control. Error bars denote the mean ± SD of eight fields from three representative mice treated with UNC0642 or the mean ± SD of three fields from three representative vehicle treated mice. Statistical significance for treated vs. vehicle (*P ≤ 0.05, **P ≤ 0.01) was determined by non-parametric t-test (Mann–Whitney). J Antileukemic activity of UNC0642 in hCD45 + T-ALL leukemia cells (bone-marrow and peripheral cells T-ALL lymphoblasts) in a PDLX T-ALL, #0121, murine model after 26 days of UNC0642 treatment (5 mg/kg/IP every 48 h) or vehicle (corn oil). Statistical significance for treated vs. vehicle (*P ≤ 0.05) was determined by non-parametric t-test (Mann–Whitney). K Antileukemic activity of UNC0642 in hCD45 + T-ALL leukemia cells (bone-marrow and peripheral cells T-ALL lymphoblasts) in a PDLX T-ALL, #0122, murine model after 9 days of UNC0642 treatment (5 mg/kg/IP every 48 h) or vehicle (corn oil). Statistical significance for treated vs. vehicle (*P ≤ 0.05) was determined by non-parametric t-test (Mann–Whitney). On the right Kaplan–Meier survival plots showing the overall survival (OS) of PDLX T-ALL mice treated or untreated with UNC0642 (5 mg/kg/IP every 48 h) (**P ≤ 0.01).

