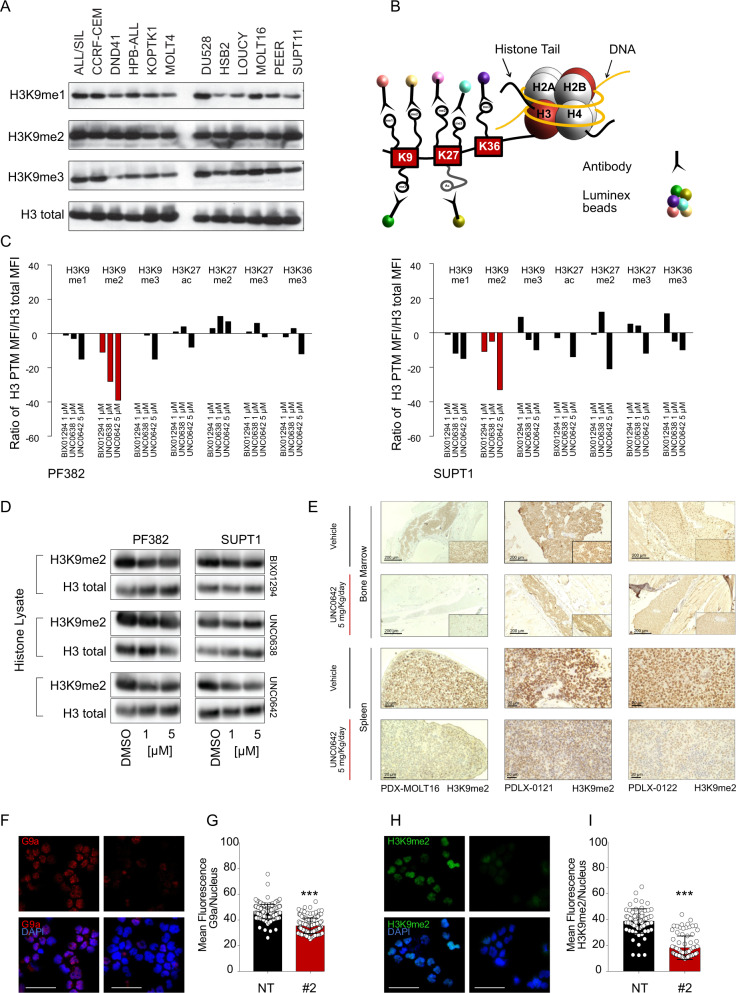
Fig. 3. G9a inhibitors reduce H3K9me2 level in T-ALL.
A Western blot showing expression of H3K9me1, H3K9me2, and H3K9me3 in a panel of T-ALL cell lines. An acidic histone protein extraction was performed. Total histone-3 (H3) was used as a loading control. B Schematic representation of the histone protein methyltransferase, Luminex beads assay. The beads/target panel included H3K9me1, H3K9me2, H3K9me3, H3K27ac, H3K27me2, H3K27me3, and H3K36me3. C Luminex PMT assay. Lysates were obtained from acidic extraction upon 48 h treatment with the indicated concentrations of G9a inhibitors. Histograms show the median fluorescence intensity of each histone mark normalized to the intensity of total H3. Detection was repeated three times by diluting initial protein concentration with a 2.5-dilution series. Graphs are representative of one out of three Luminex quantifications. Red bar indicates H3K9me2 quantification values. D Western blot showing expression of H3K9me2 in PF382 and SUPT1 cells treated at the indicated concentrations of G9a inhibitors for 48 h. Protein lysates were obtained using an acidic histone extraction protocol and stained with an antibody recognizing the H3K9me2 residue or total H3 used as a loading control. E Modulation of H3K9me2 in xenografted murine models after 12 (PDX-MOLT16), 26 (PDLX-0121), 9 (PDLX-0122) days of UNC0642 treatment (5 mg/kg/IP every 48 h) or vehicle (corn oil). Top panel = bone marrow, bottom panel = spleen. Scale bar: 20 μm. Formalin-fixed, paraffin embedded tissue sections were stained with anti H3K9me2. Scale bars, 200 or 20 μm. F Effect of EHMT2 knock down on H3K9me2 in PF382 cells 2 days post sgRNA selection. Immunofluorescence of permeabilized PF382 cells stained with anti-G9a (red) and anti-H3K9me2 (green) (H) is shown. Cell nuclei were stained with DAPI (blue). Scale bar: 100 μm. NT = non-targeting, #2 = sgRNA #2 directed against EHMT2. G Quantitative immunofluorescence analysis of G9a/EHMT2 and H3K9me2. I Nuclear signal in PF382 cells after 2 days post sgRNA selection. Error bars denote the mean ± standard deviation (SD) of fluorescence of single nucleus (arbitrary units); Statistical significance among NT vs. sgRNA #2 was determined by unpaired t-test (***P ≤ 0.001).

