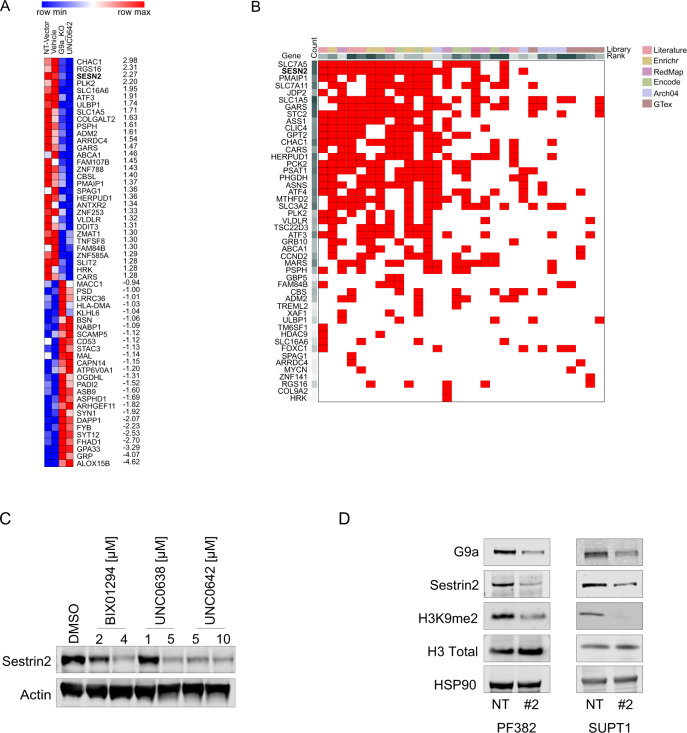
Fig. 4. Transcriptional consequences of G9a loss in T-ALL.
A Heatmap showing mRNA expression of differentially expressed genes in non-targeting sgRNA (sgNT), sgRNA targeting EHMT2 (#2) or T-ALL cells treated either with vehicle or UNC0642 (P < 0.05 and Log2 fold changes > 1.5) and ranked for signal to noise ratio (snr). Each column represents the mean of two biological replicates per condition. B Clustergram showing transcription factor enrichment analysis (TFEA). G9a loss gene set from (A) was compared to the ChEA3 benchmark libraries as listed in https://amp.pharm.mssm.edu/chea3/#top for TF target over-representation analysis. Red boxes show the overlapping query gene targets among top library results. C Western blot showing expression of sestrin2 in PF382 cells treated at the indicated concentrations of G9a inhibitors after 48 h. Actin was used as a loading control. D Western blot showing expression of G9a/EHMT2, sestrin2, H3K9me2, and H3 Total, in PF382 and SUPT1 cells after 2 days post sgRNA selection. HSP90 was used as a loading control. NT non targeting; #2 = sgRNA #2 directed against EHMT2.

