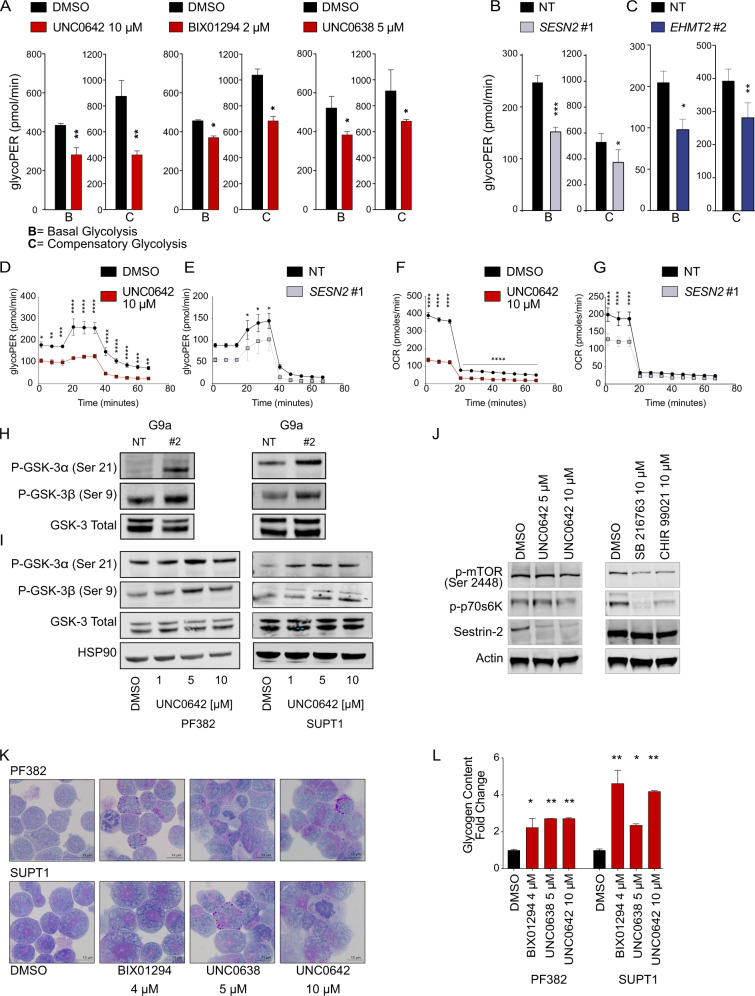
Fig. 5. G9a/EHMT2 modulates Glycogen Synthase Kinase-3 (GSK-3) in T-ALL.
A Glycolytic phenotype in PF382 cells. Histograms represent mean ± SD of three replicates of PF382 T-ALL cells treated with DMSO, BIX01294 (2 μM), or UNC0638 (5 μM) or UNC0642 (10 μM) on the x-axis. The y-axis represents the glycolytic proton efflux rate (PER) at the basal and compensatory level. Statistical significance among groups (*P < 0.05, **P < 0.01) was determined by a non-parametric t-test (Mann–Whitney). B Glycolytic phenotype in SESN2 knock down PF382 cells. Histograms represent mean ± SD of three replicates of SESN2 deprived T-ALL cells. The y-axis represents the glycolytic proton efflux rate (PER) at the basal and compensatory level. Statistical significance among groups (*P < 0.05, ***P < 0.001) was determined by a non-parametric t-test (Mann–Whitney). C Glycolytic phenotype in EHMT2 knock down PF382 cells. Histograms represent mean ± SD of three replicates of EHMT2 deprived T-ALL cells. The y-axis represents the glycolytic proton efflux rate (PER) at the basal and compensatory level. Statistical significance among groups (*P < 0.05, **P < 0.01) was determined by a non-parametric t-test (Mann–Whitney). D Time resolved glycolytic proton efflux rate (glycoPER). Traces represent the mean ± SD of three replicates of PF382 cells treated with DMSO or UNC0642 analyzed over 70-min time course experiments. Statistical significance among groups for treated vs. vehicle (DMSO) (*P < 0.05, **P < 0.01, ***P < 0.001, ****P < 0.0001) was determined by two-way ANOVA using Bonferroni’s correction for multiple comparison testing. E Time resolved glycolytic proton efflux rate (glycoPER). Traces represent the mean ± SD of three replicates of SESN2 knock down PF382 analyzed over 70-min time course experiments. Statistical significance among groups for treated vs. vehicle (DMSO) (*P < 0.05) was determined by two-way ANOVA using Bonferroni’s correction for multiple comparison testing. F Oxygen Consumption Rate (OCR). Traces represent the mean ± SD of three replicates of PF382 T-ALL cells treated with DMSO or UNC0642 analyzed over a 70-min time course experiment. Statistical significance among groups for treated vs. vehicle (DMSO) (****P < 0.0001) was determined by two-way ANOVA using Bonferroni’s correction for multiple comparison testing. G Oxygen Consumption Rate (OCR). Traces represent the mean ± SD of three replicates of PF382 SESN2 knockdown cells analyzed over a 70-min time course experiment. Statistical significance among groups for treated vs. vehicle (DMSO) (****P < 0.0001) was determined by two-way ANOVA using Bonferroni’s correction for multiple comparison testing. H Modulation of GSK-3 in PF382 and SUPT1 cells after 2 days post sgRNA selection. Western blot showing expression phosphorylated serine-9 in GSK-3β or serine-21 in GSK-3α in T-ALL. Protein lysates were stained with G9a/EHMT2, P-GSK-3α (Ser21), P-GSK-3β (Ser9), GSK-3 total. NT non targeting, #2 = sgRNA #2 directed against EHMT2. See Fig. 6E for EHMT2 knock down level. I Modulation of GSK-3 by the G9a inhibitor UNC0642. Western blot showing phosphorylation of serine-9 in GSK-3β or serine-21 in GSK-3α in T-ALL. Cell lysates were obtained after 48 h of drug treatment as indicated. Protein lysates were stained with P-GSK-3α (Ser21), P-GSK-3β (Ser9), and GSK-3 Total. HSP90 was used as loading control. J Western blot showing level of p-mTOR (Ser-2448), sestrin2, and p-p70s6K in PF382 cells after UNC0642 treatment or 24 h of GSK-3 inhibitor (SB216763 and CHIR-99021) treatment at the indicated concentration. Actin was used as a loading control. K Micrographs documenting Periodic Acid Shift (PAS) staining in PF382 and SUPT1 cell lines treated with vehicle (DMSO) or the indicated doses of BIX01294, UNC0638, and UNC0642 for 48 h. Fine dispersed granular or blocks of PAS + (magenta) cytoplasmic and perinuclear material correspond to glycogen. Scale bars: 13 µm. L Effect of G9a inhibitors BIX01294, UNC0638, and UNC0642 on cellular glycogen content. Histograms show the glycogen fold change increase relative to a DMSO control after G9a inhibitors treatment for 48 h. Error bars denote the mean ± standard deviation (SD) of two biological replicates. Statistical significance among groups (*P ≤ 0.05, **P ≤ 0.01) was determined by a non-parametric t-test (Mann–Whitney).

